14. Using Splunk for Visualization#
14.1. Network Metrics Visualization Solutions#
14.1.1. Splunk#
See kafka/splunk documentation Section on how to deploy
source will be http:splunk_hec_token
sourcetype will be http_event
- Within the splunk-kafka configuration you can specify for the “value.converter” either
“value.converter”: “org.apache.kafka.connect.json.JsonConverter”
“value.converter”: “org.apache.kafka.connect.storage.StringConverter”
The incoming data will be json or stored as a string with base64 data for the metric.
- Splunk Dashboards
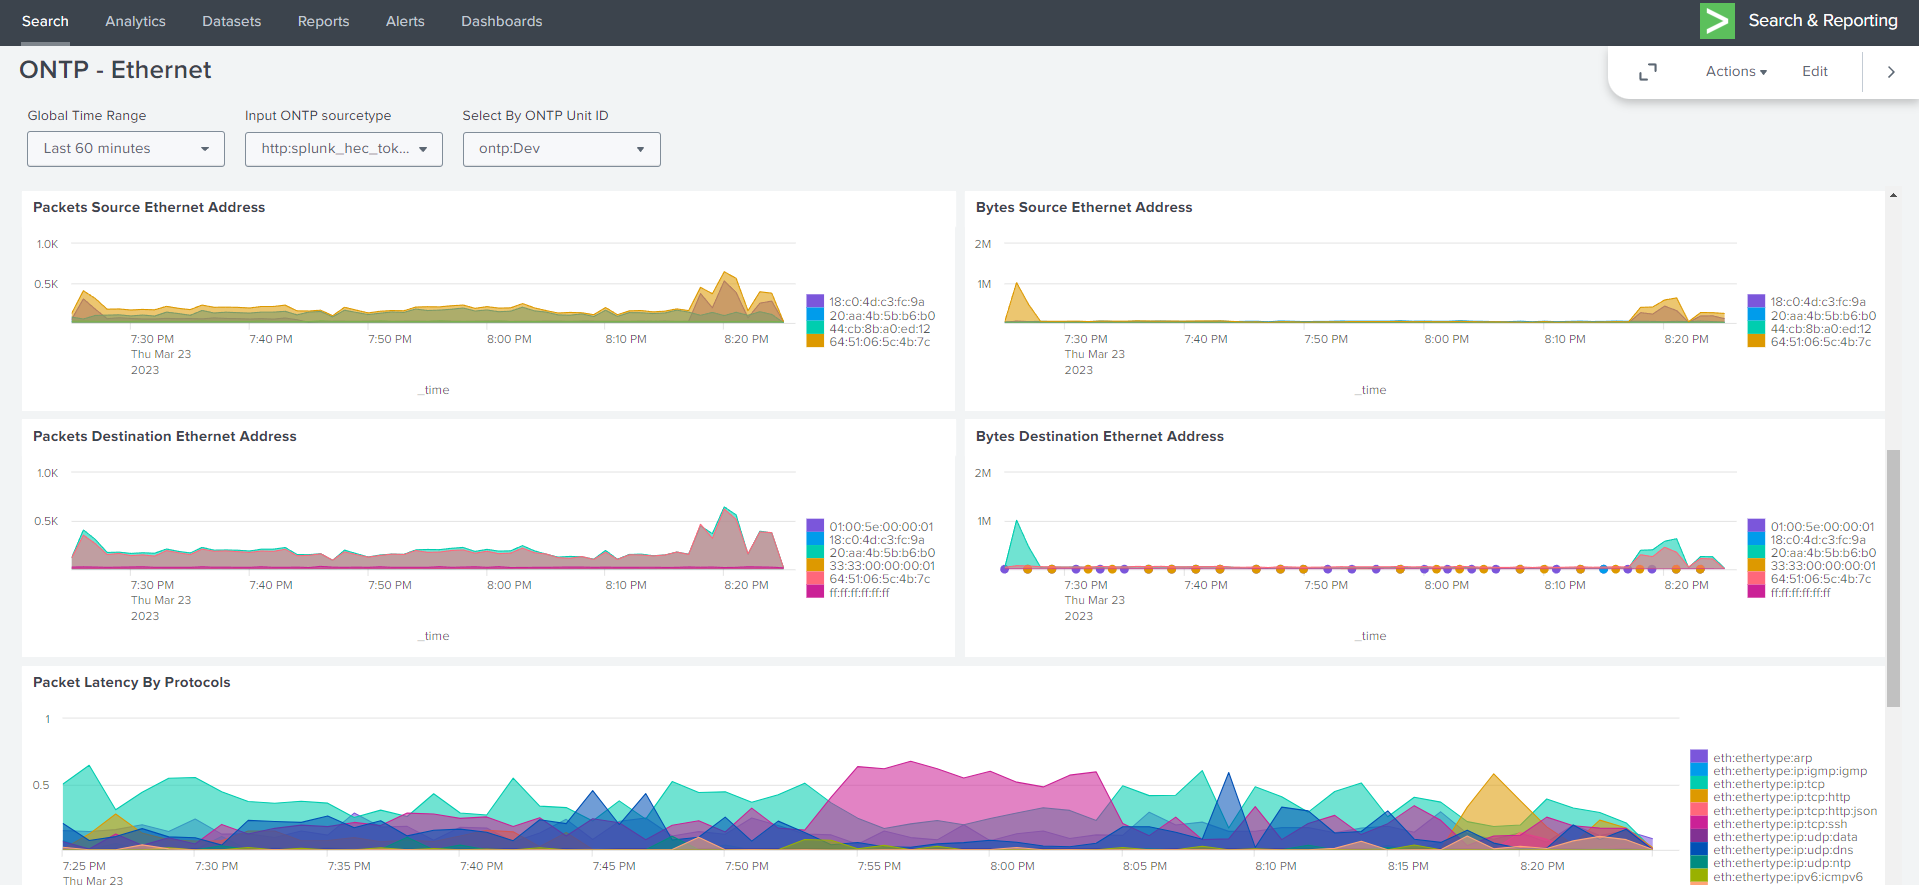
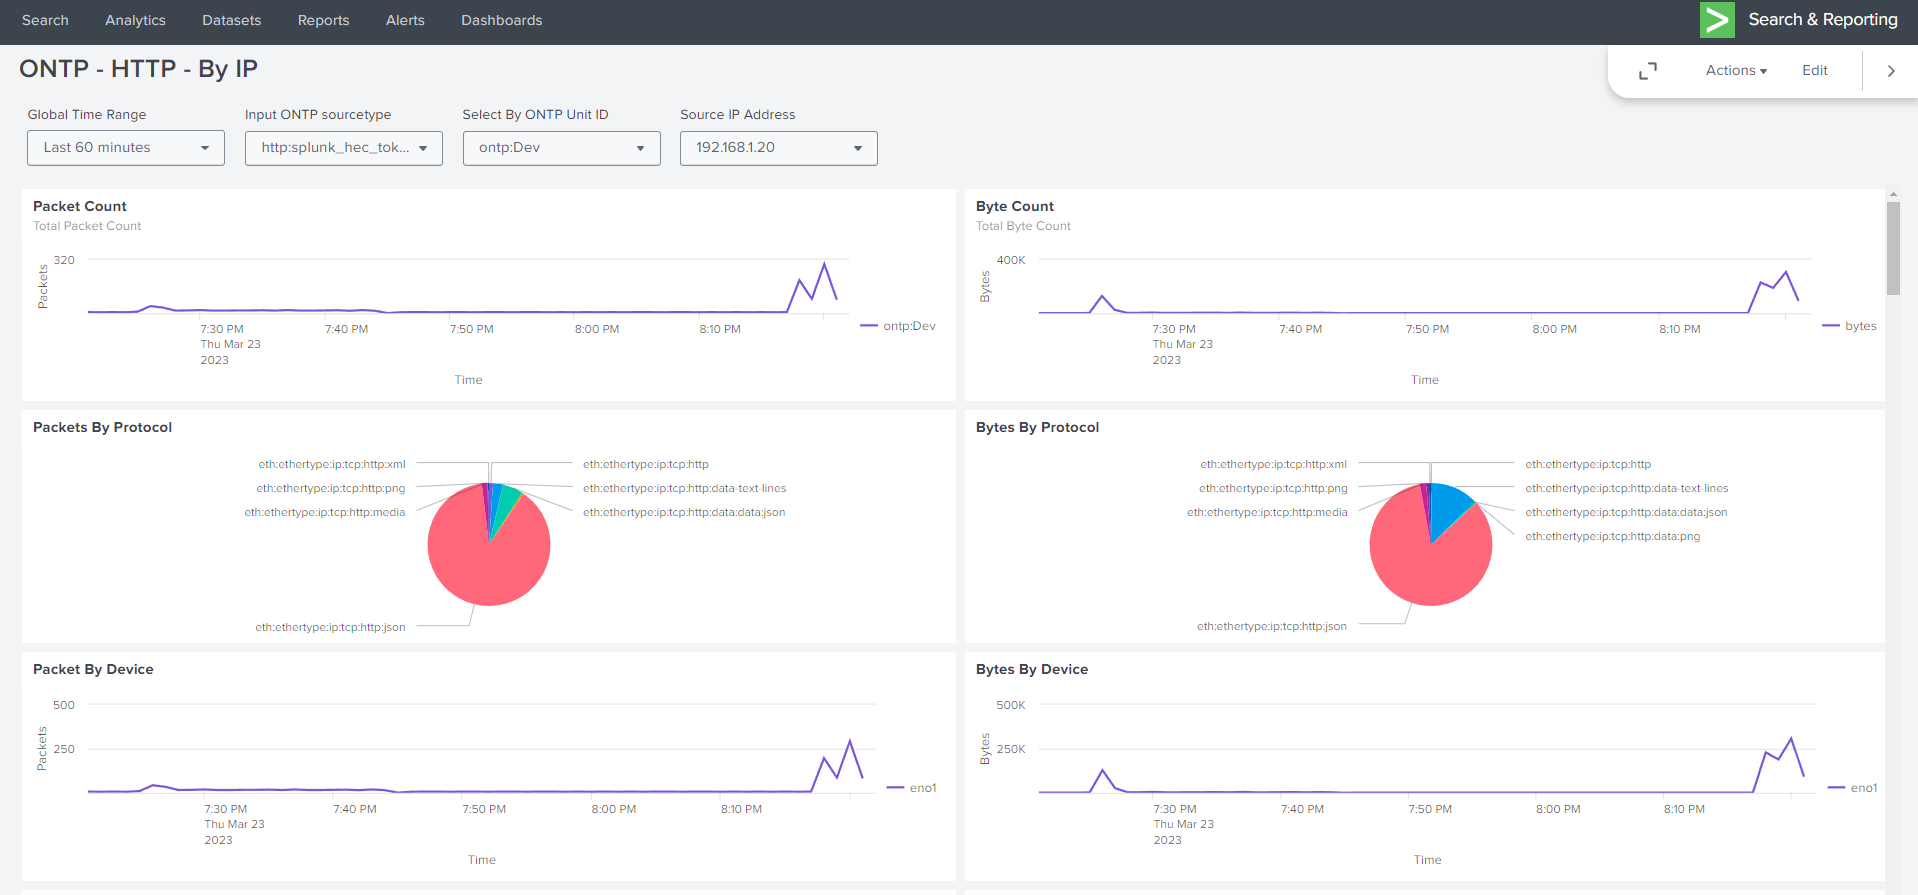
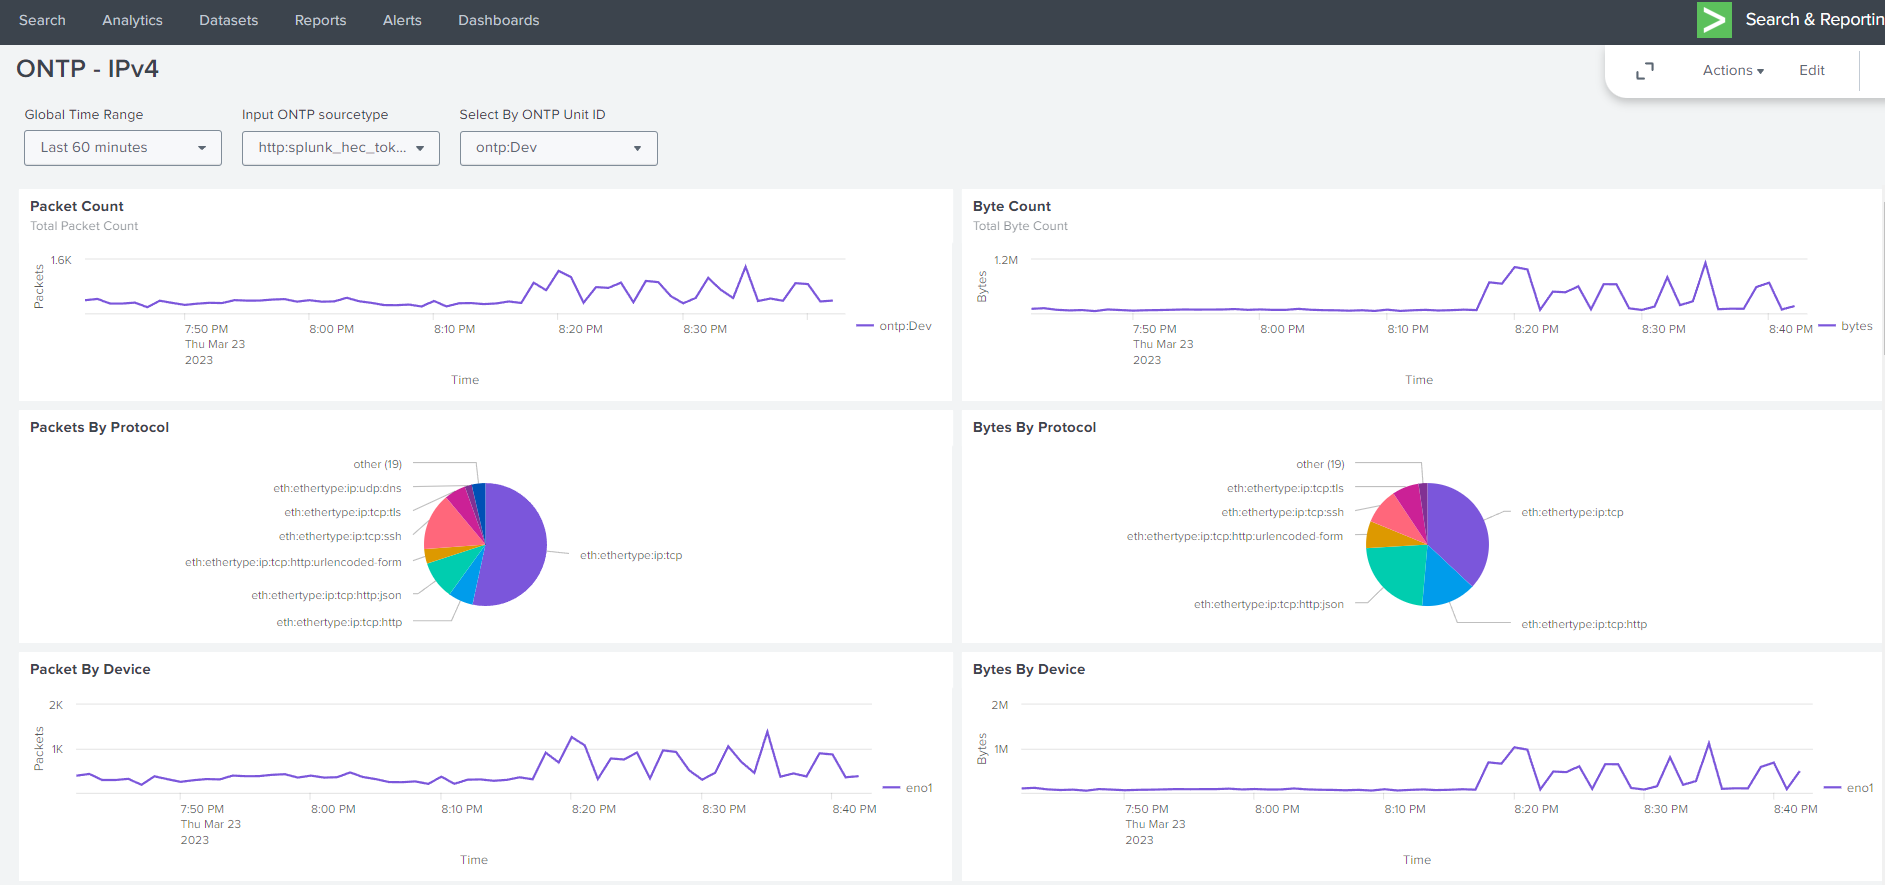
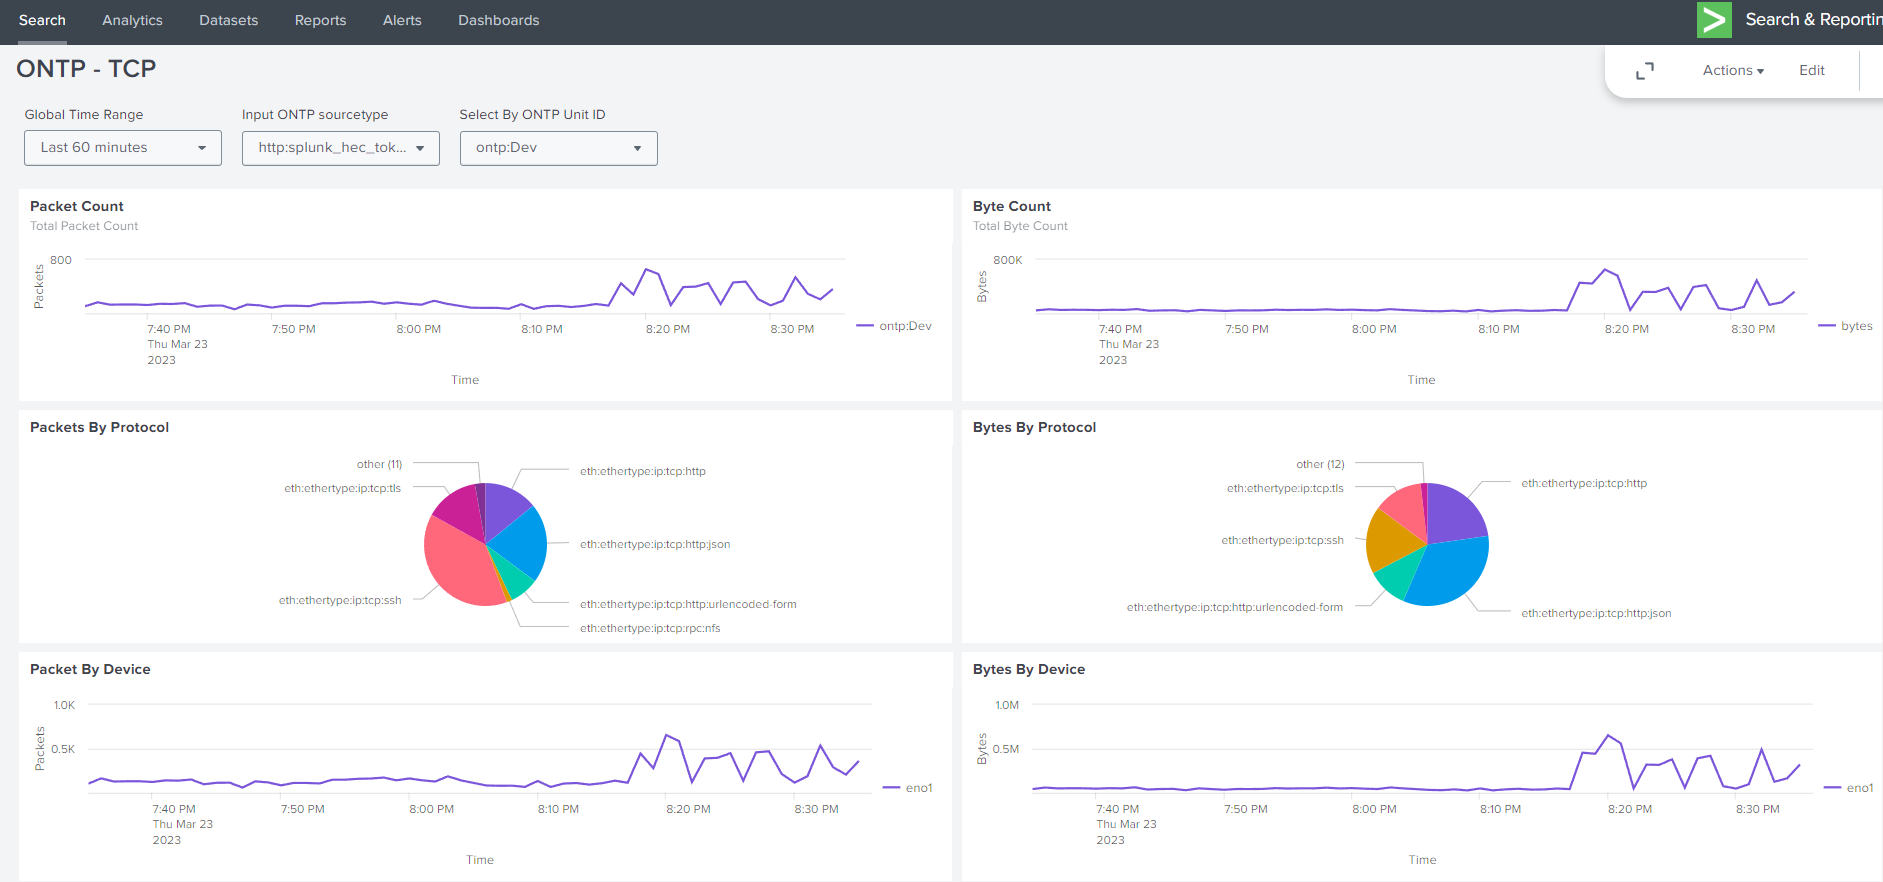
You can download our example splunk dashboards
Warning
Using JsonConverter allows auto decode of the json object within the splunk interface.
If you use StringConverter you will have to do that docding via splunk search functions.
- Also note that the configuration of the ontp-wire or ontp-mbus kafka output must match what you expect.
So you will have to specify for the kafaka: { …, output-koutput: json|base64, .. }
14.1.2. Query To pull metrics by sourcetype#
If you use JsonConverter in the connector configuration
Note
View Network Metric from JsonConverter
The below query will pull tcp metrics from the system
source="http:splunk_hec_token"
| rename layers.frame.protocols as protos, layers.ip.src_host as src_host, layers.ip.dst_host as dst_host
| where if(like(protos,"%:tcp:%"),1,0) == 1
If you use StringConverter in the connector configuration - decode base64 and expand metric json data
Note
View Network Metric when using StringConverter
source="http:splunk_hec_token"
| eval ds=split(_raw,";")
| eval host_uuid=mvindex(ds,0)
| eval host_serial=mvindex(ds,1)
| eval unitid=mvindex(ds,2)
| eval convoid=mvindex(ds,3)
| eval mtstamp=mvindex(ds,4)
| eval metricb64=mvindex(ds,5)
| where host_serial != "" | base64 action=decode field=metricb64 | spath input=base64
14.1.3. Setup Notes#
Note
When you use org.apache.kafka.connect.storage.StringConverter the data is not auto expanded.
Within Splunk you have to expand the data by using base64 module to decode the base64 encoded data
Also the fields for host_uuid, host_serial, unitid, convoid, cap_tstamp are not part of the base64 json.
Follow the guide on how to extract those fields.
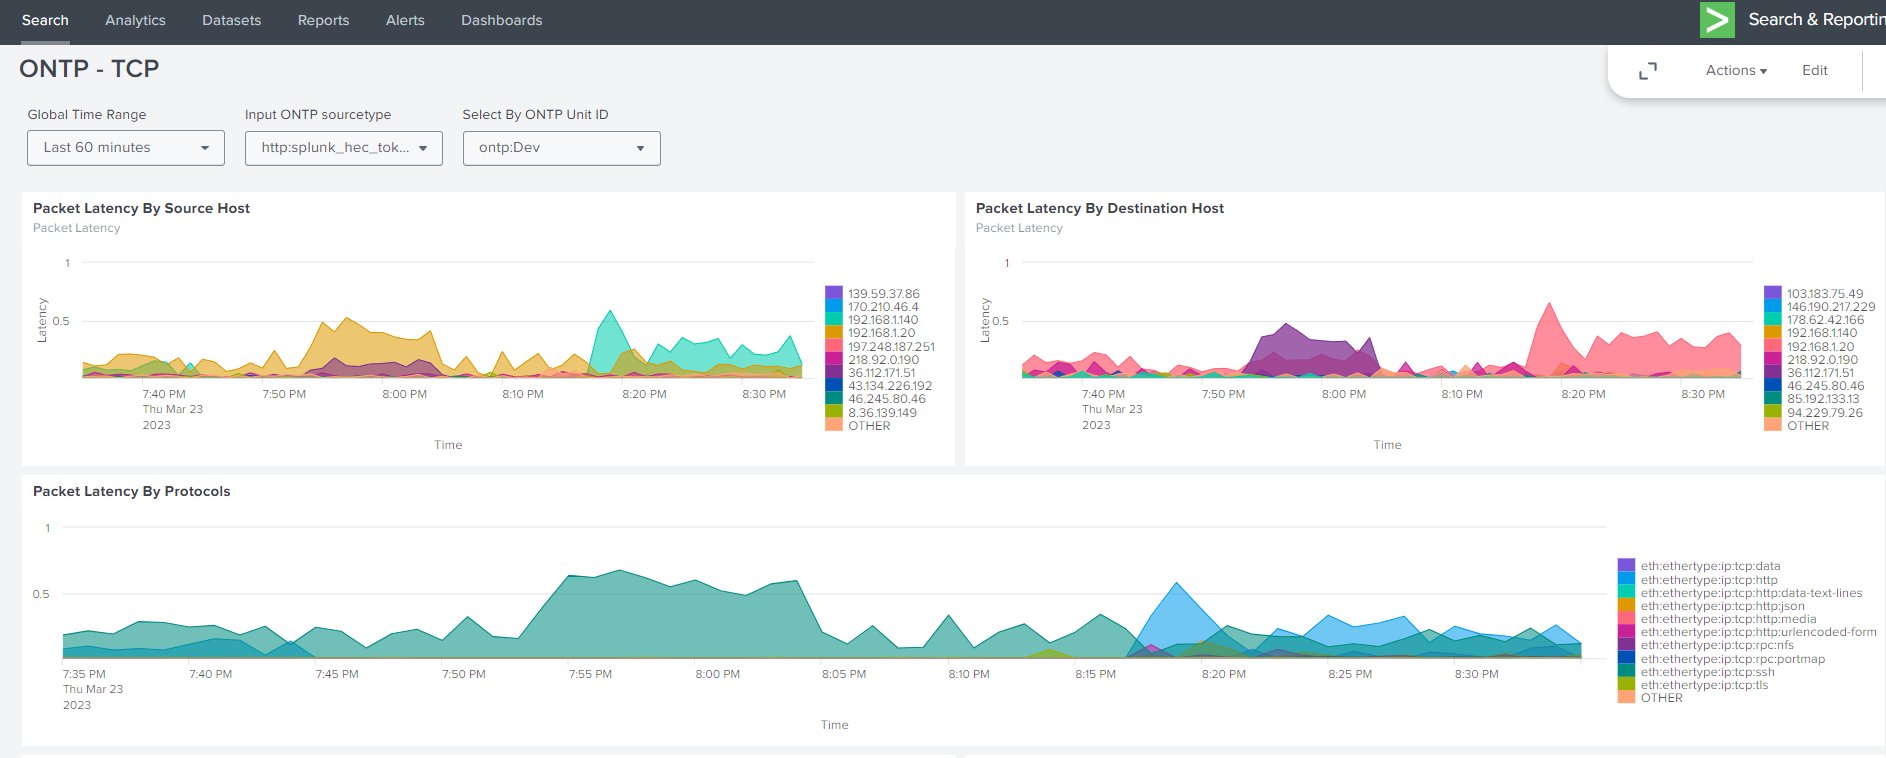
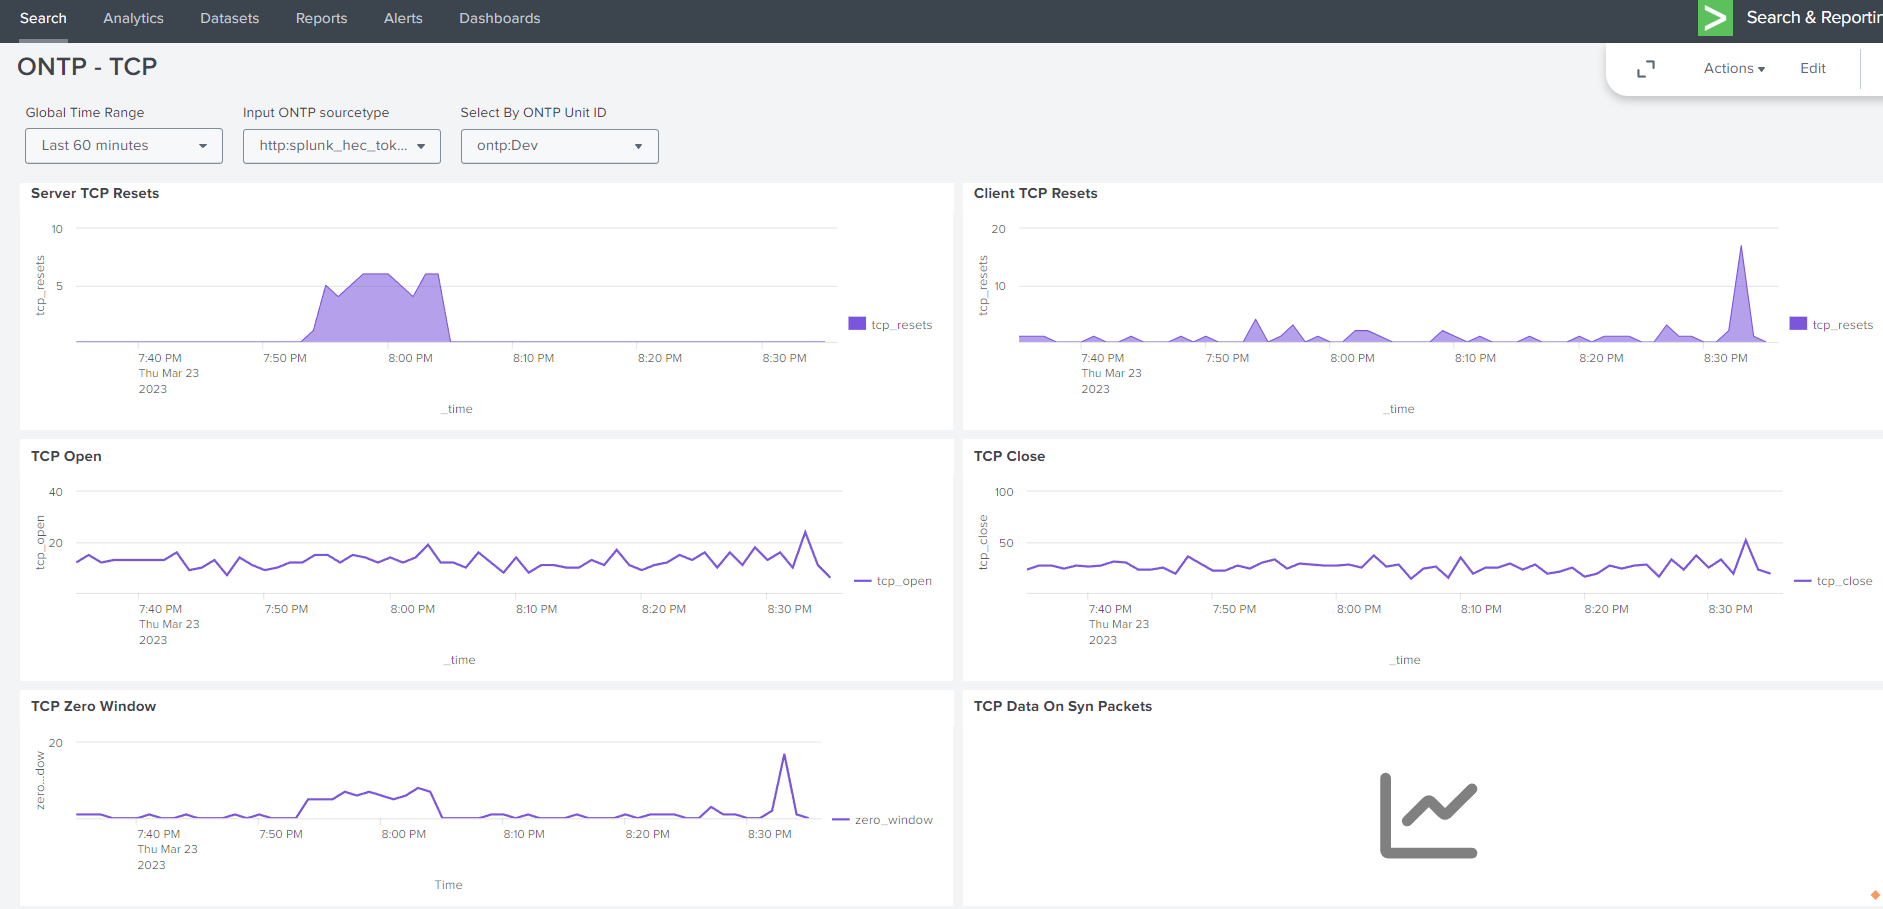
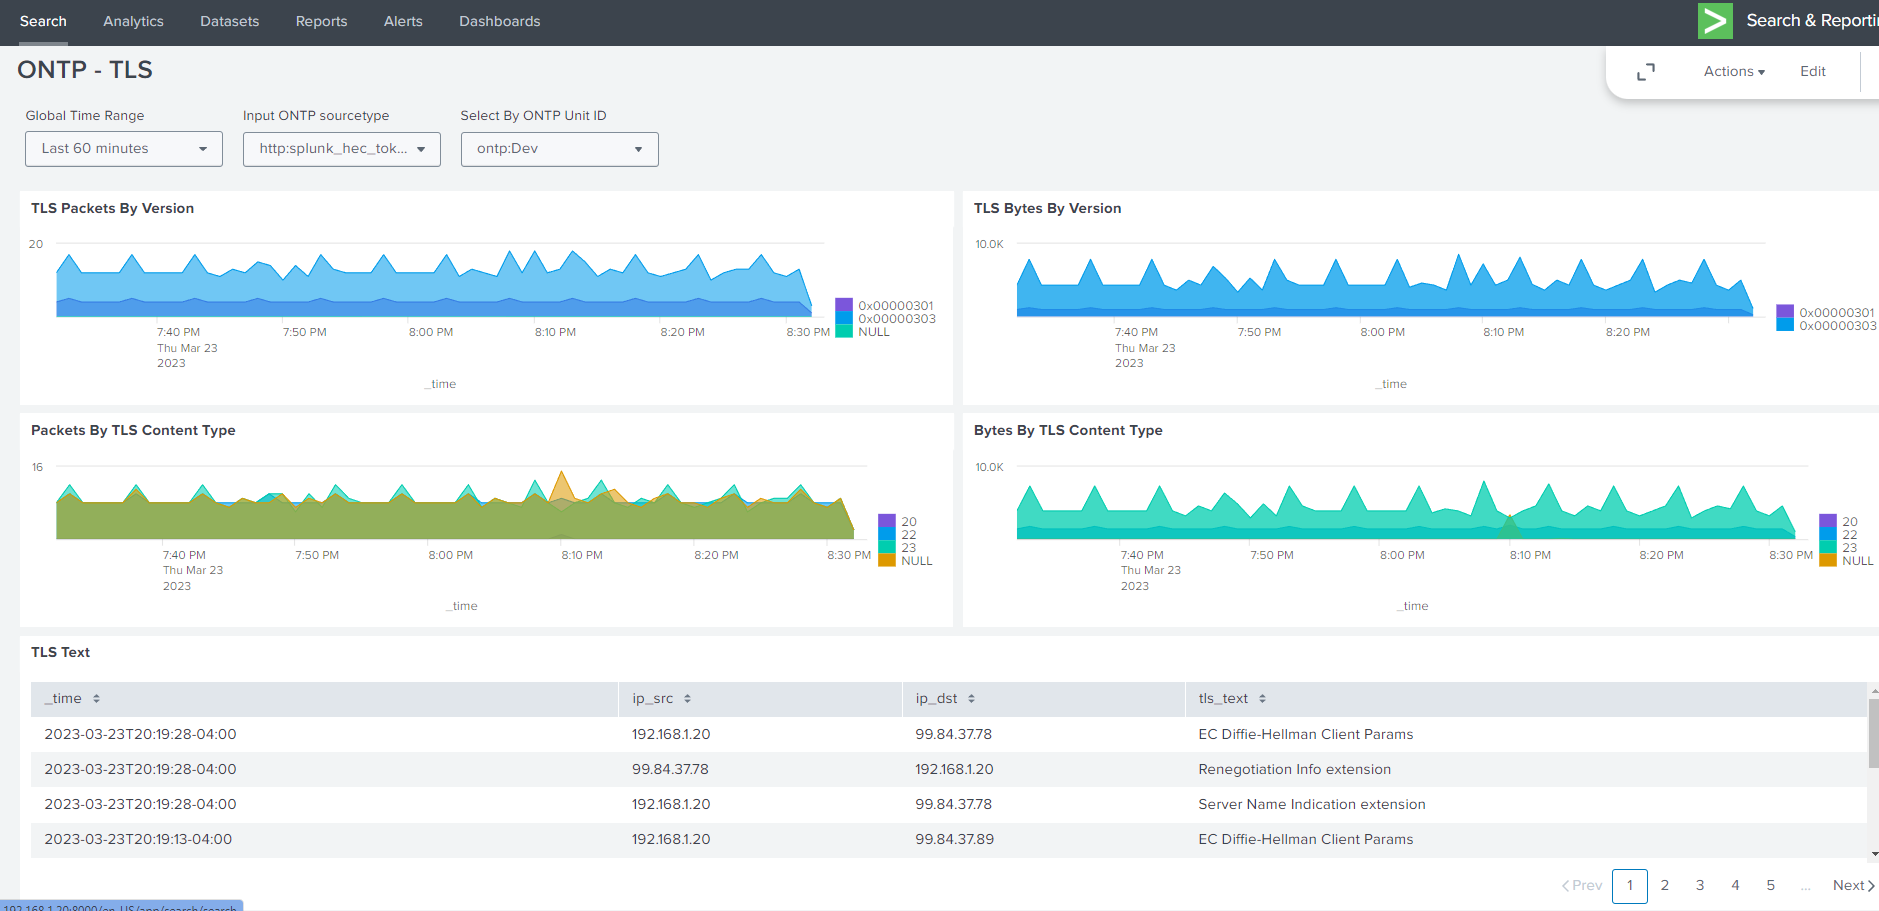
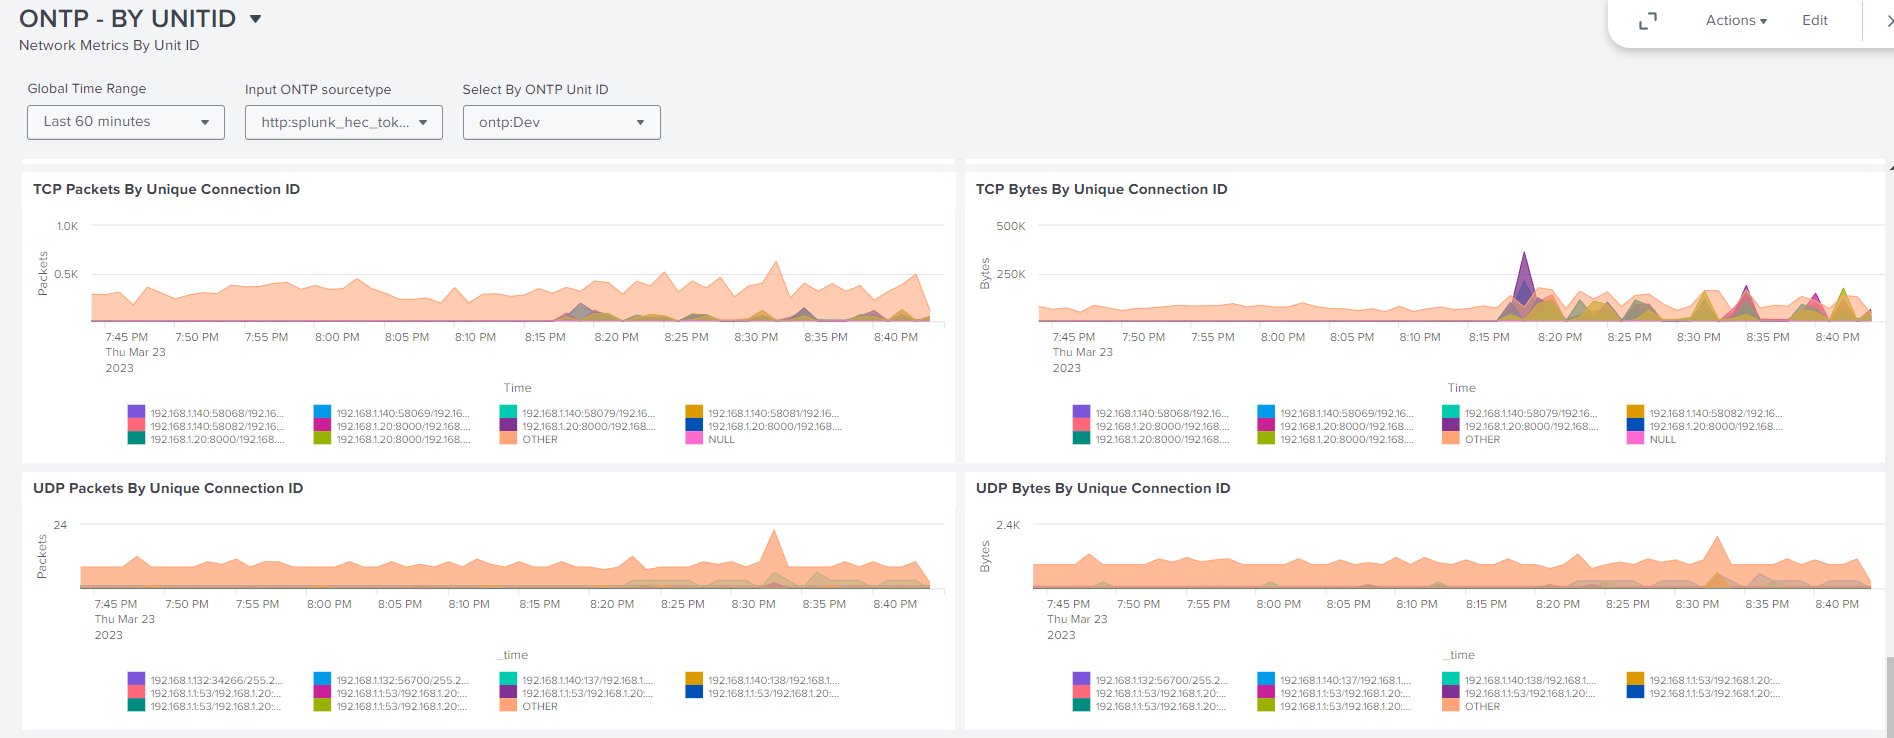
14.1.4. Dashboards Example Views#
14.1.4.1. Example Splunk Dashboards#

