4. Visualization Solutions#
4.1. Network Metrics Visualization Solutions#
You can utilize Grafana when utilizing the ONTP Real Time Platform Solution or Splunk.
Using Splunk see documentation on using splunk Using Splunk for Visualization.
- Using Grafana for metric visualization/dashboards.
- deploy docker image of grafana.
docker run -d –name=grafana -p 3000:3000 grafana/grafana
https://grafana.com/docs/grafana/next/setup-grafana/installation/docker/
we recommend you use the latest available version of grafana
- Grafana Requirements
- DataSource
PostgreSQL Data Source Plugin https://grafana.com/grafana/plugins/postgres/
PostgreSQL Data Source doc https://grafana.com/docs/grafana/v7.5/datasources/postgres/
- Adding a datasource to Grafana doc https://grafana.com/docs/grafana/v7.5/datasources/add-a-data-source/
You will need to set enable TLS/SSL Mode to require within the plugin configuration
- Dashboards
You can download our example dashboards
- Other Visualization Solutions
As long as the tool can consume information from a database then integration should be the process of cobbling the code to query the data souce.
4.1.1. Setup Notes#
Note
Database Reader For Grafana
- You should use the ‘read-only’ user for the database connection as it has only read permissions to the db.
ontp_reader posgreSQL database id
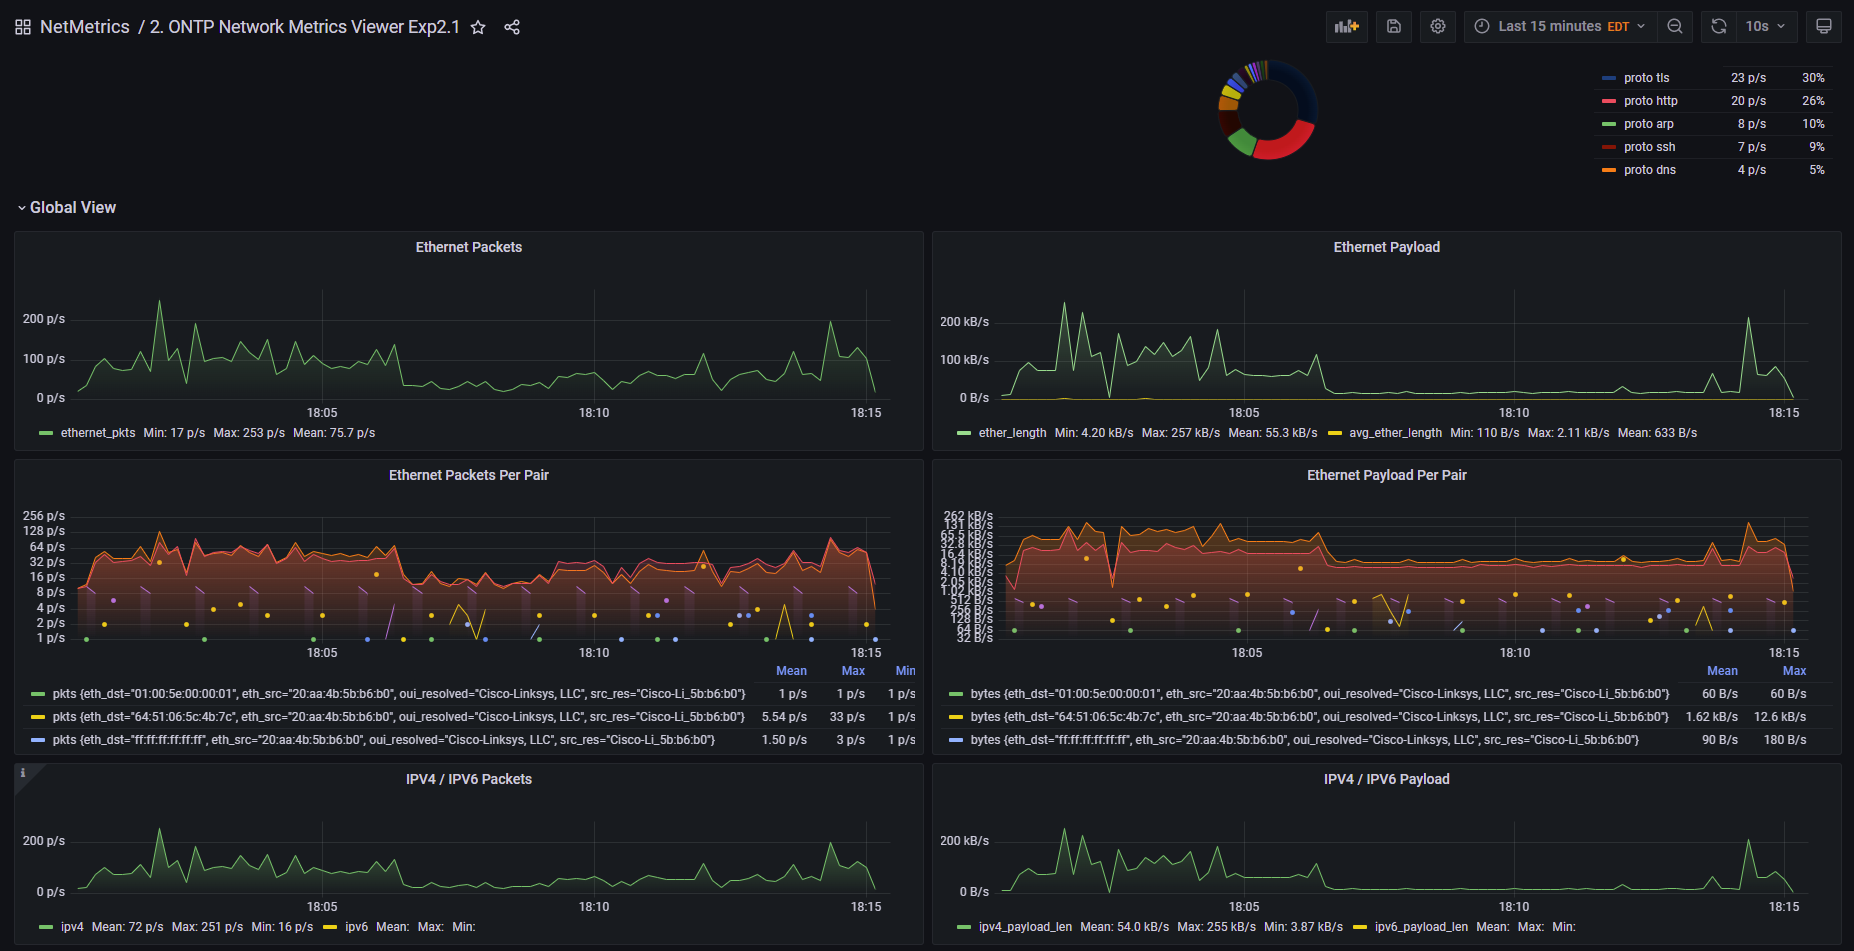
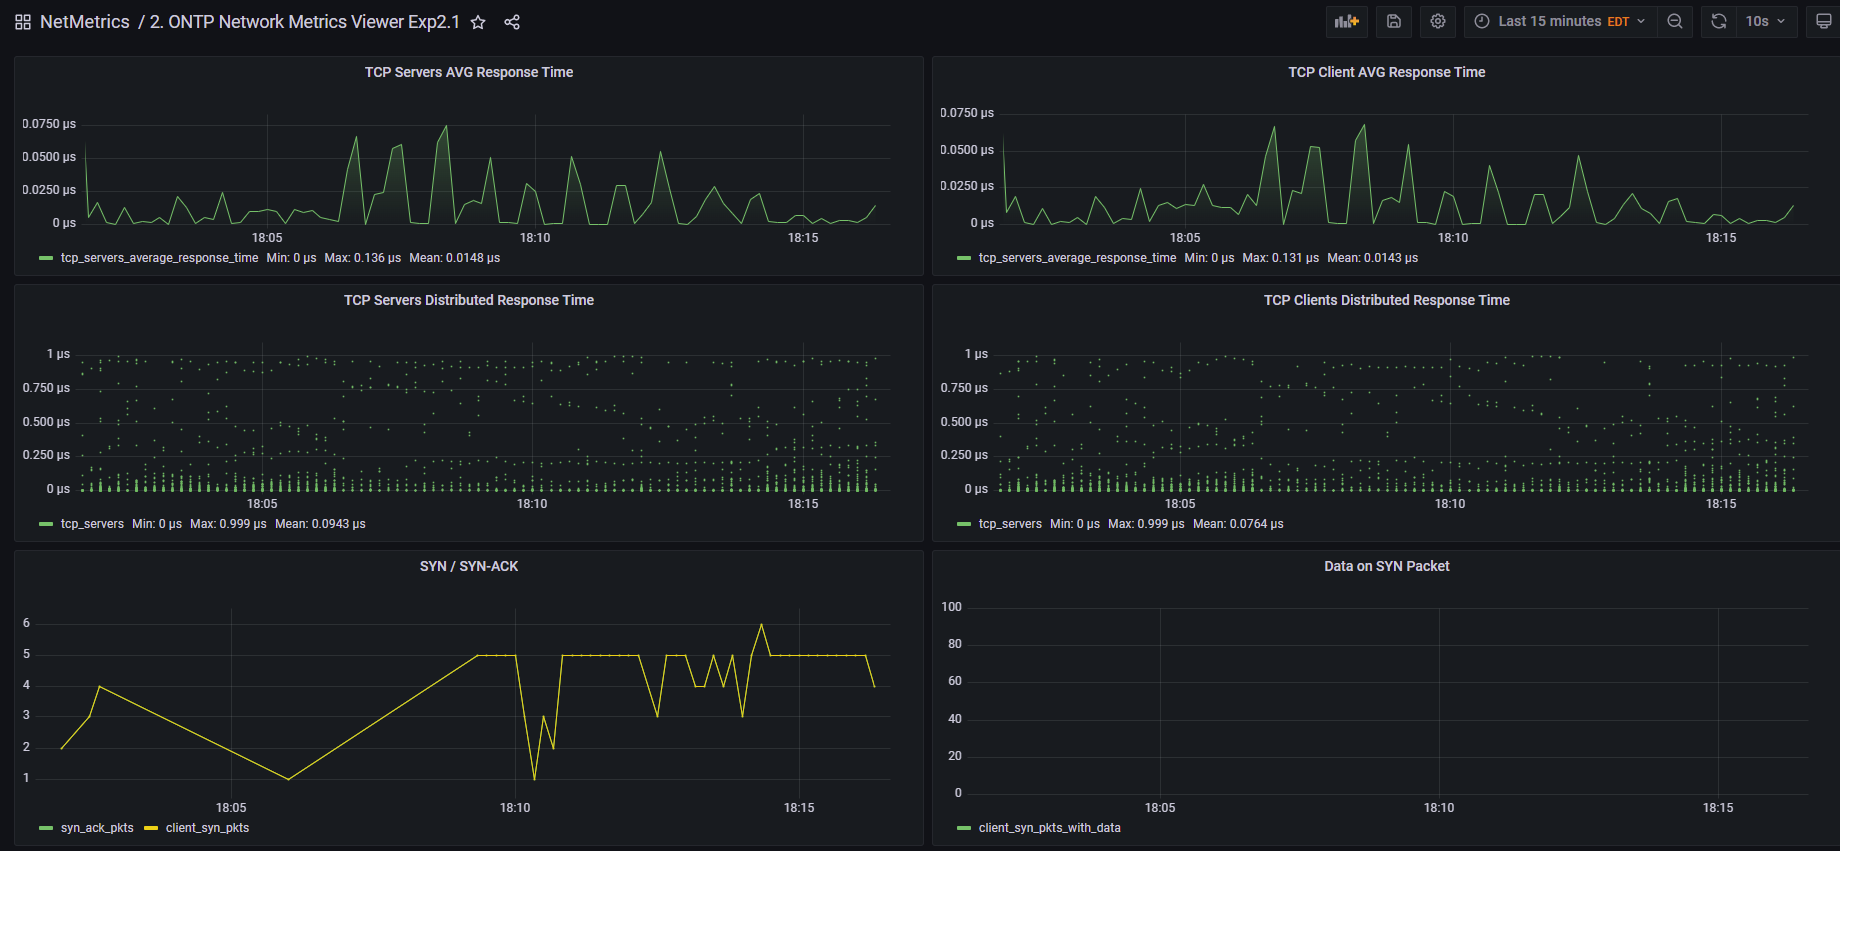
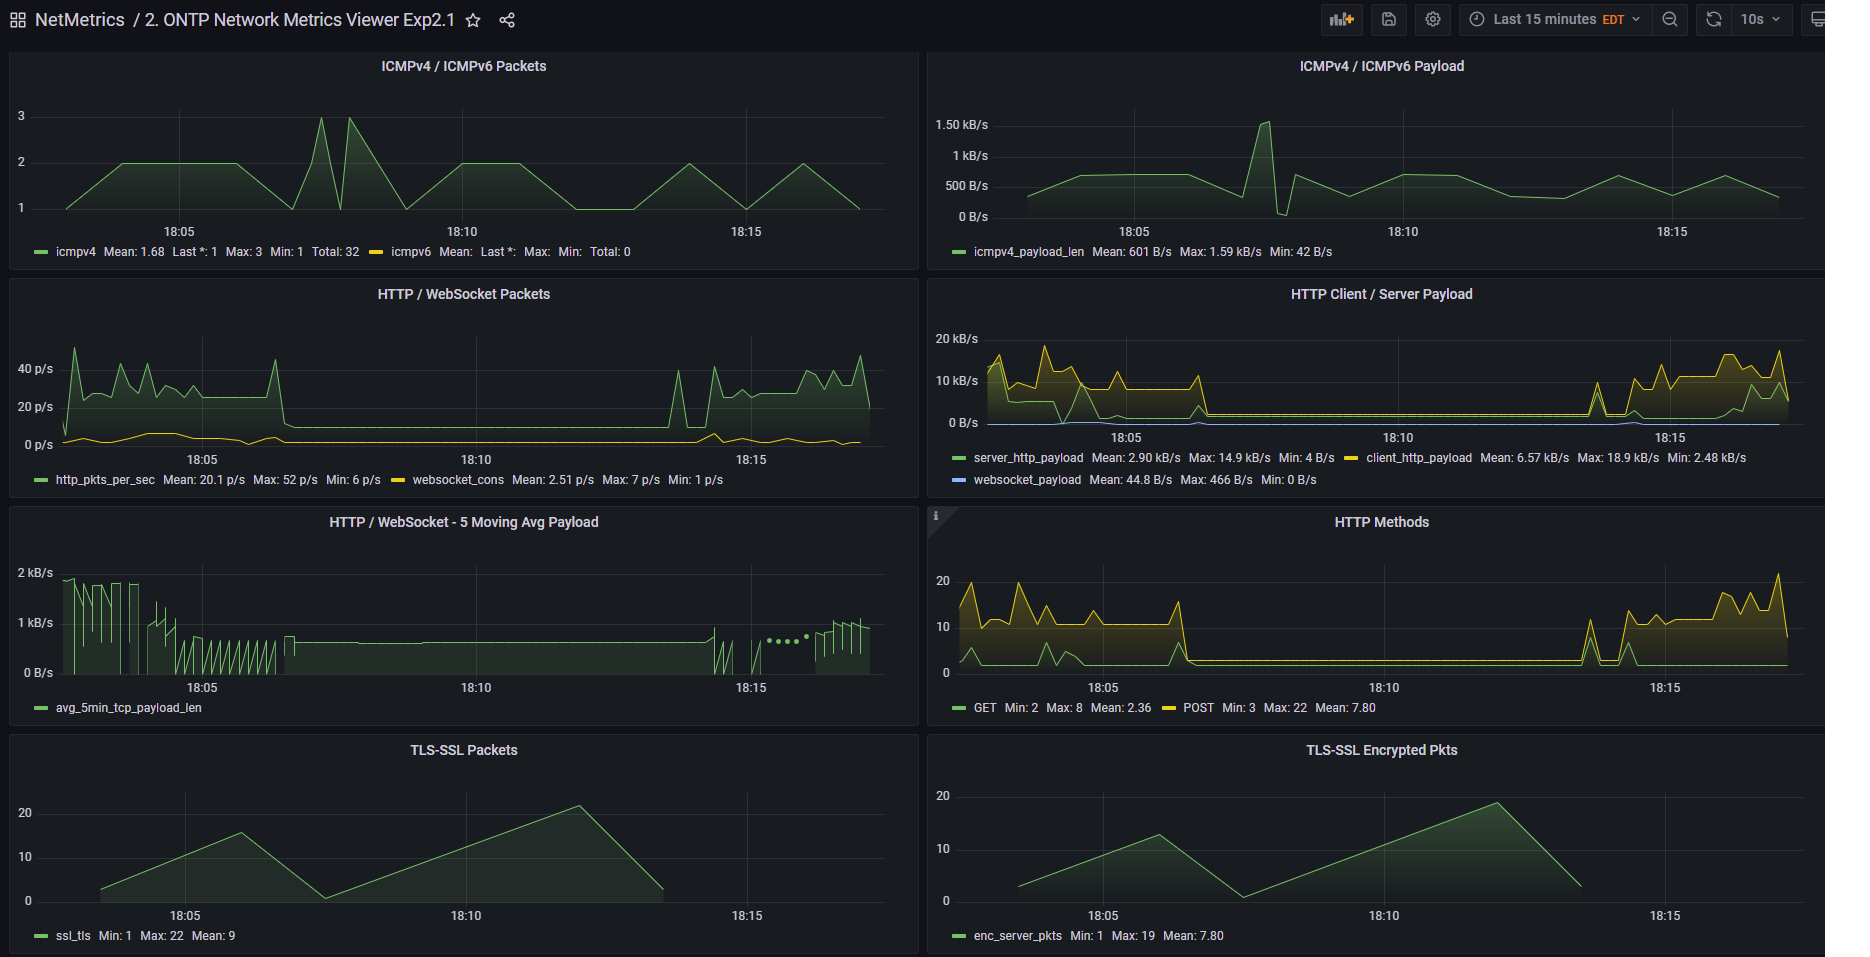
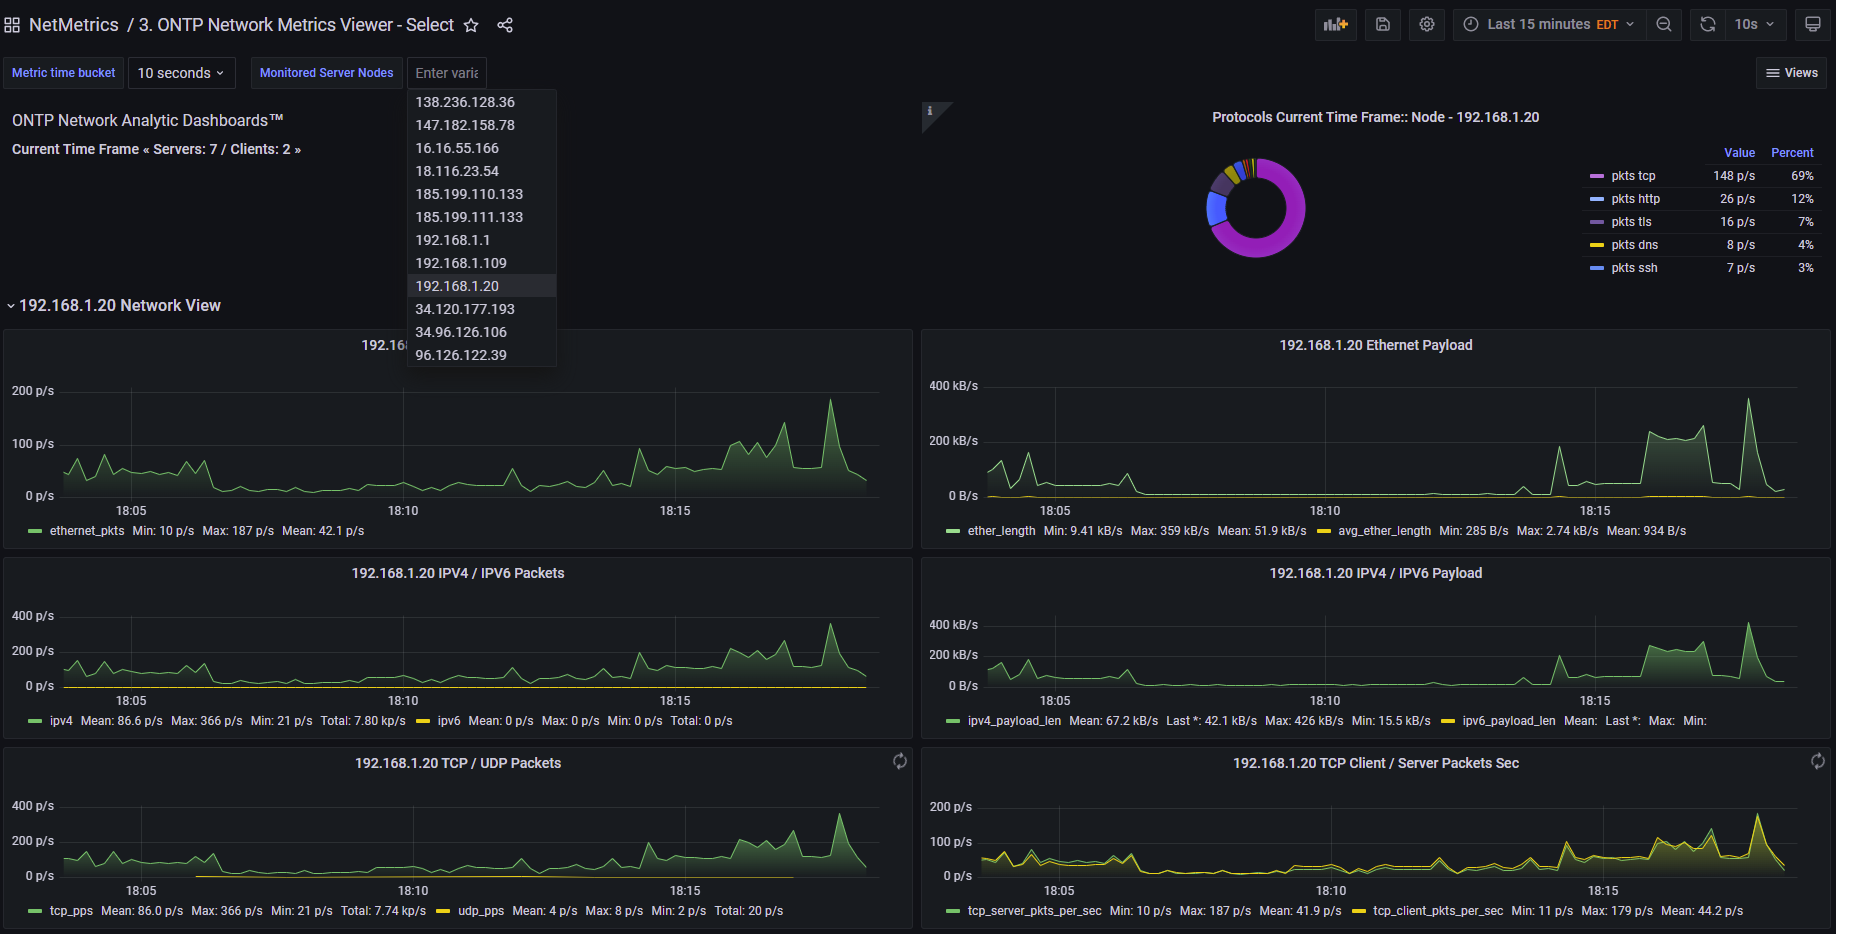
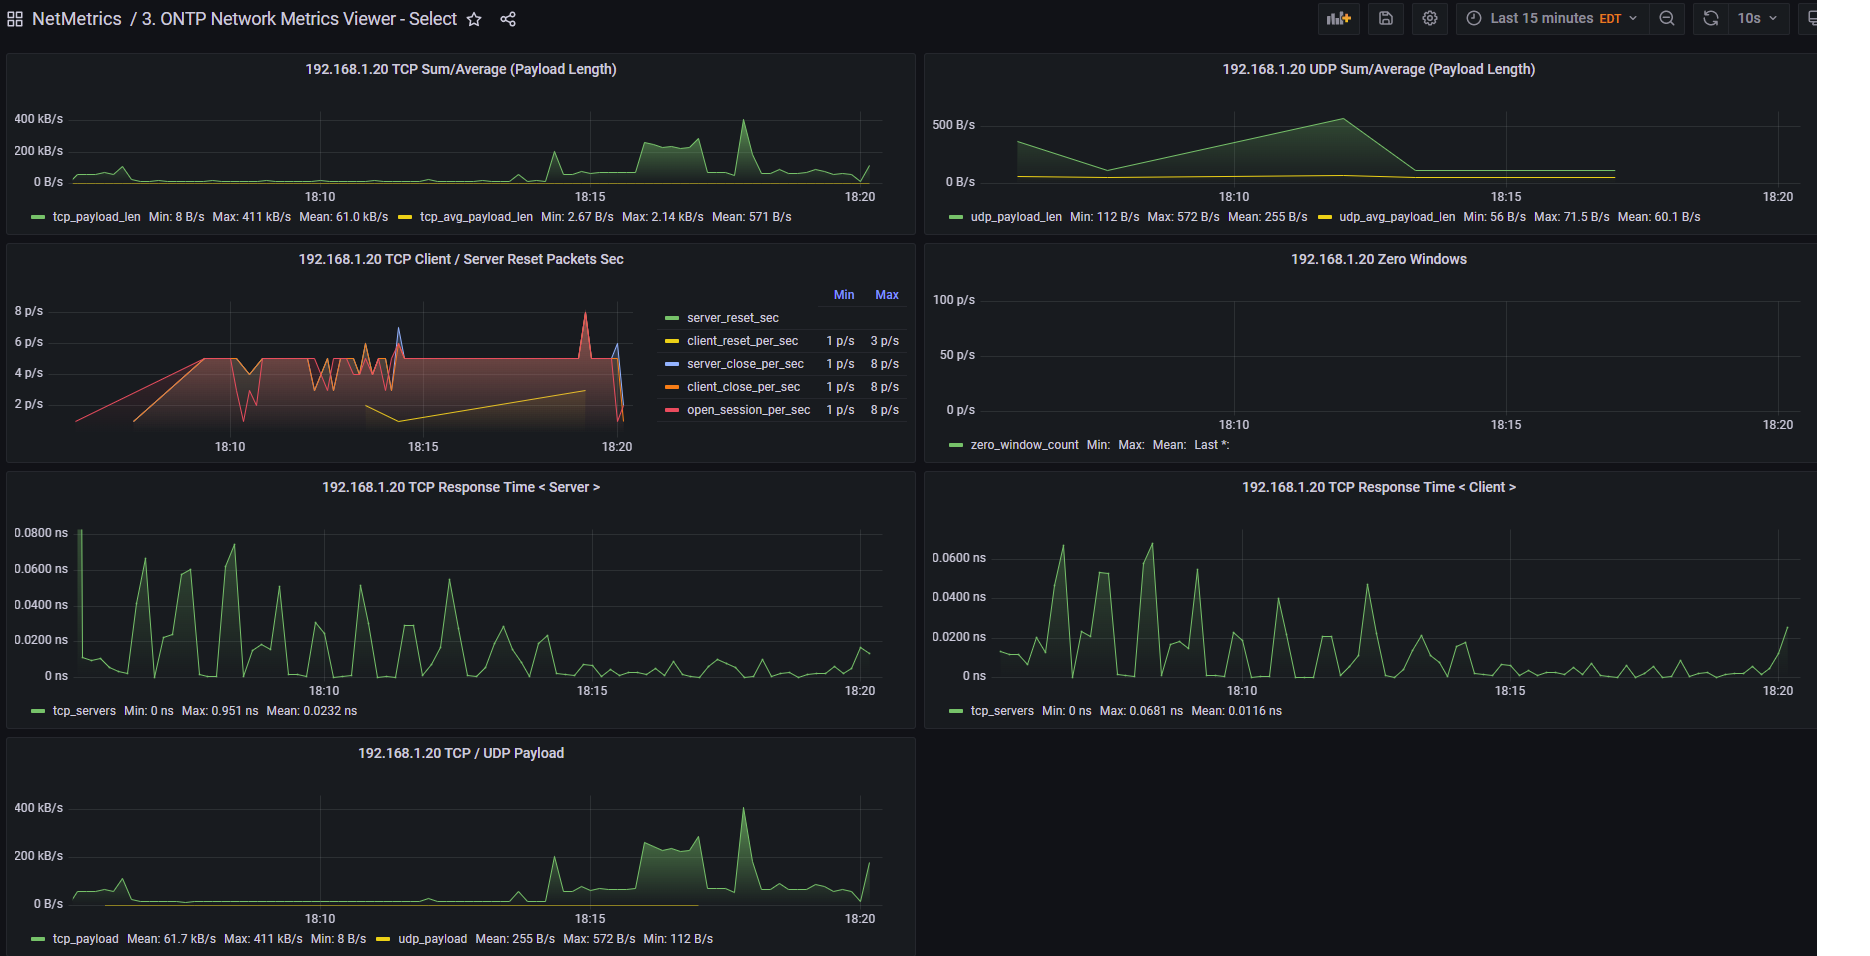
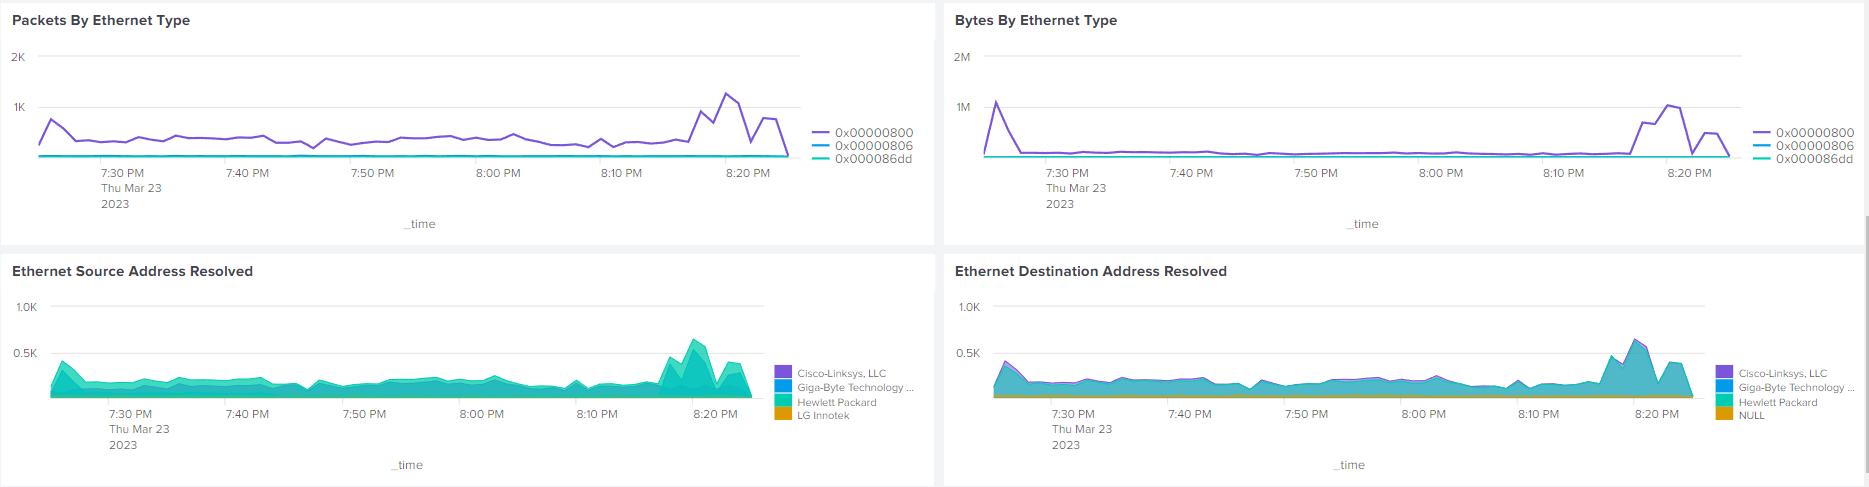
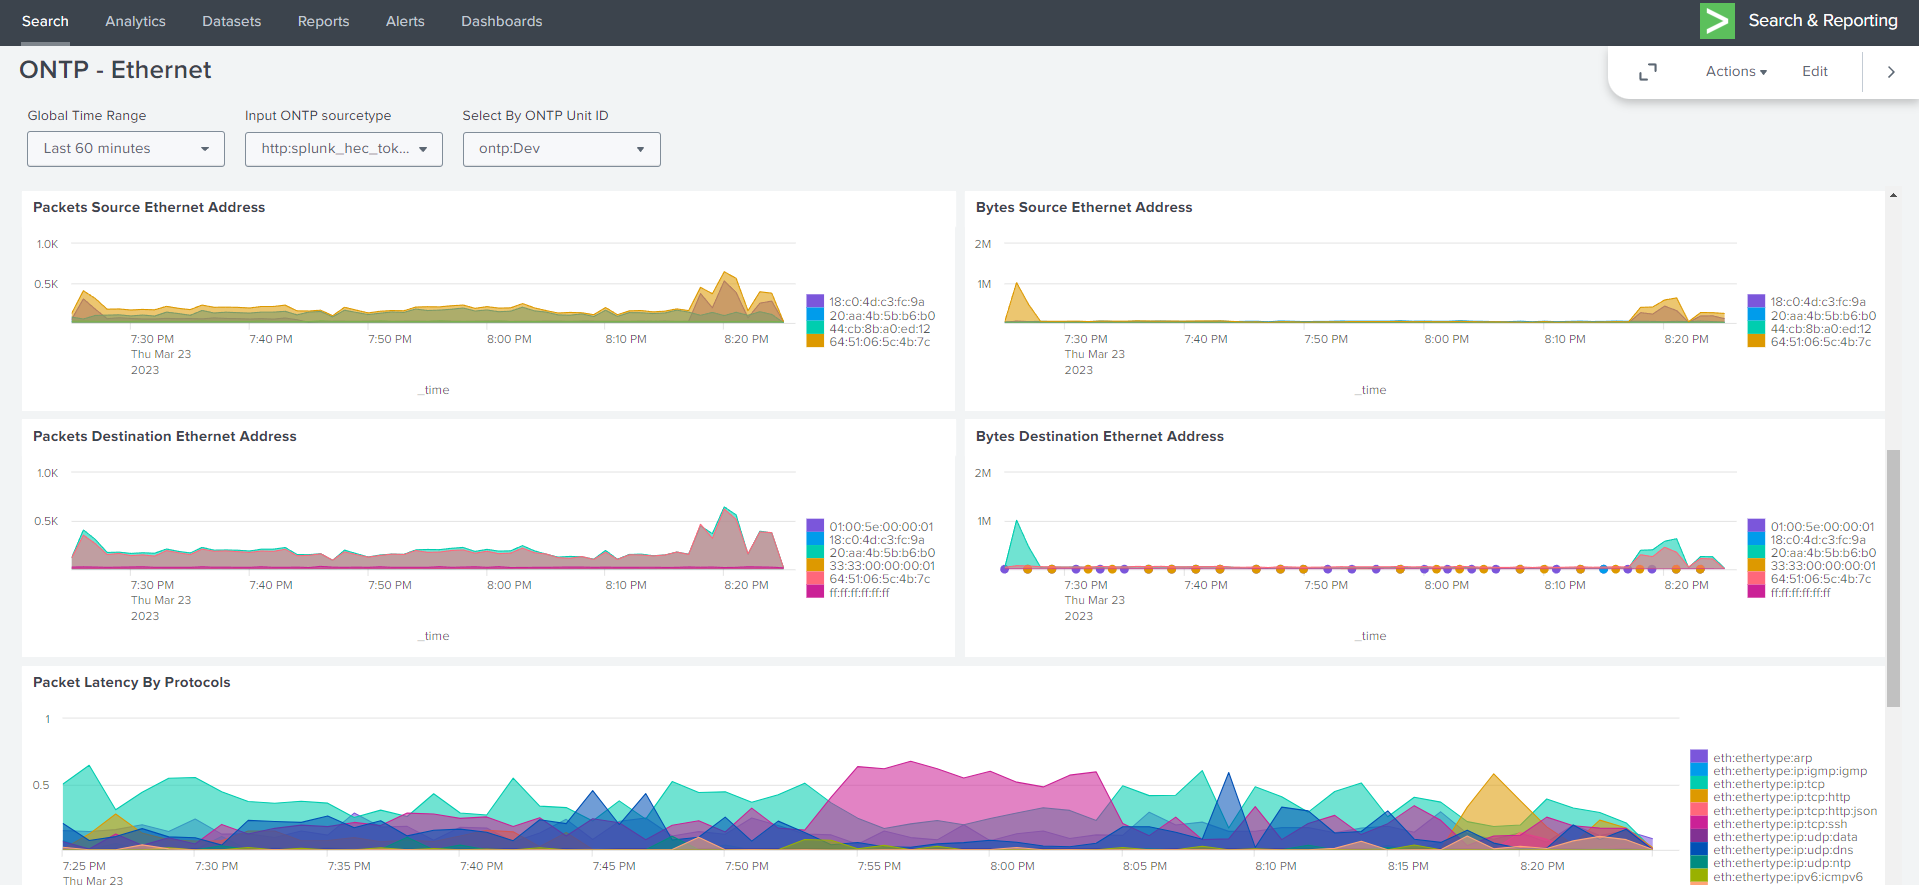
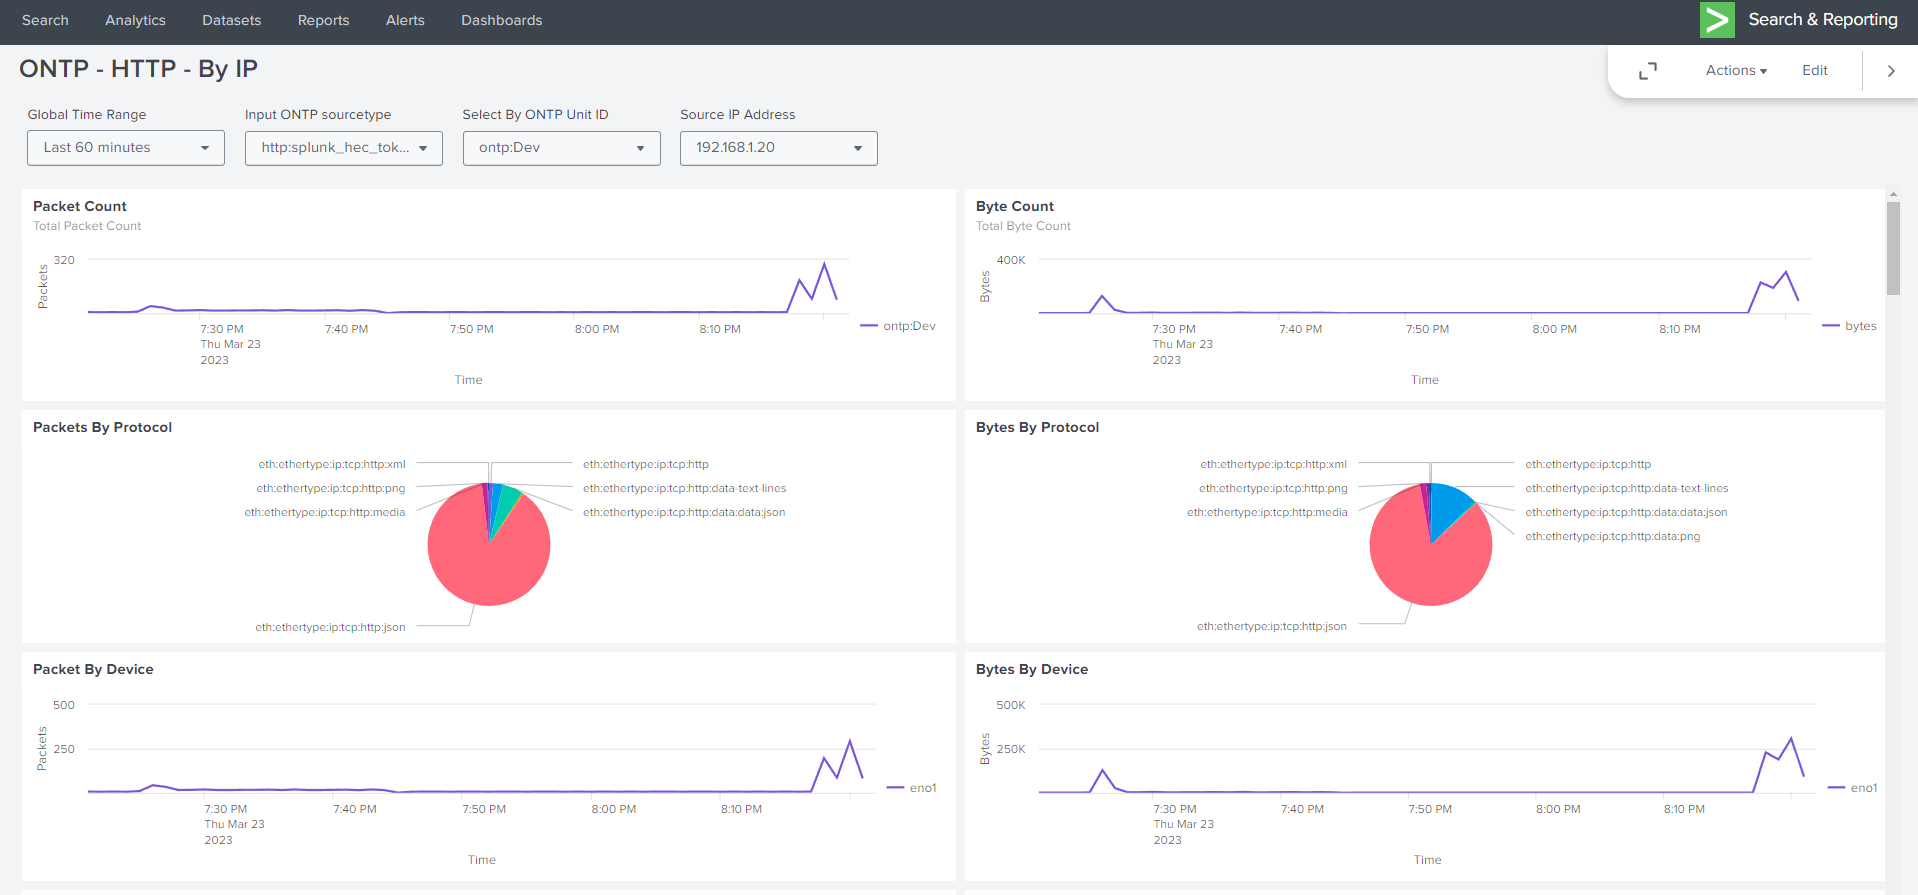
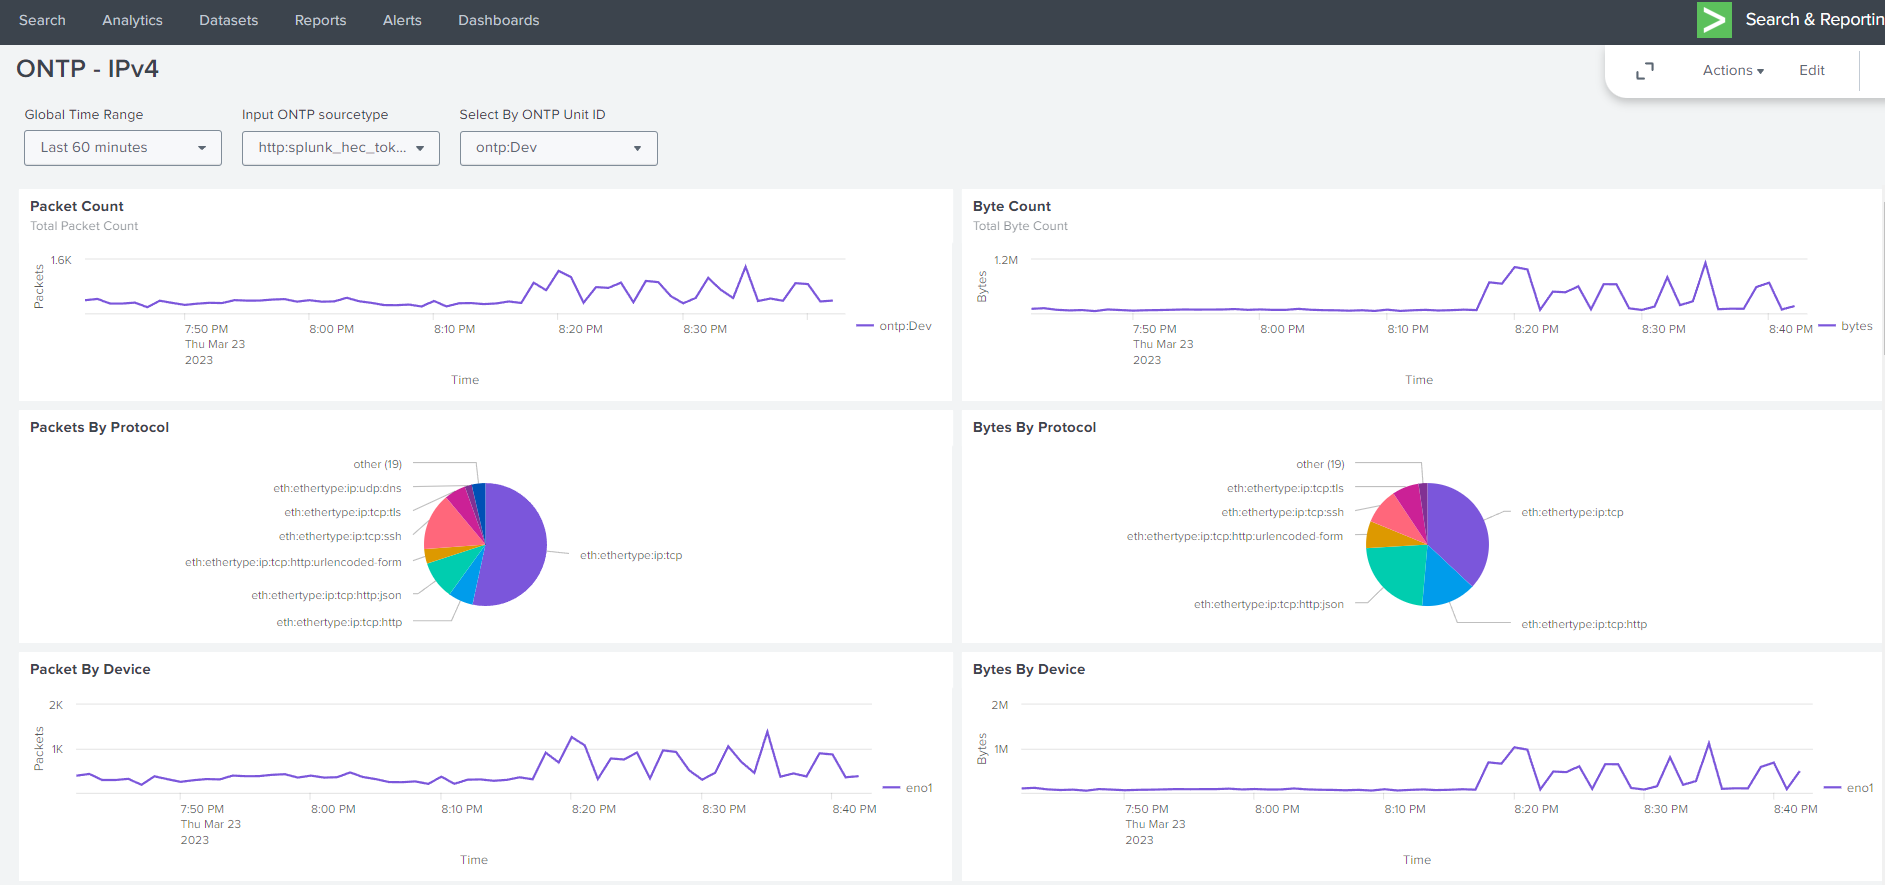
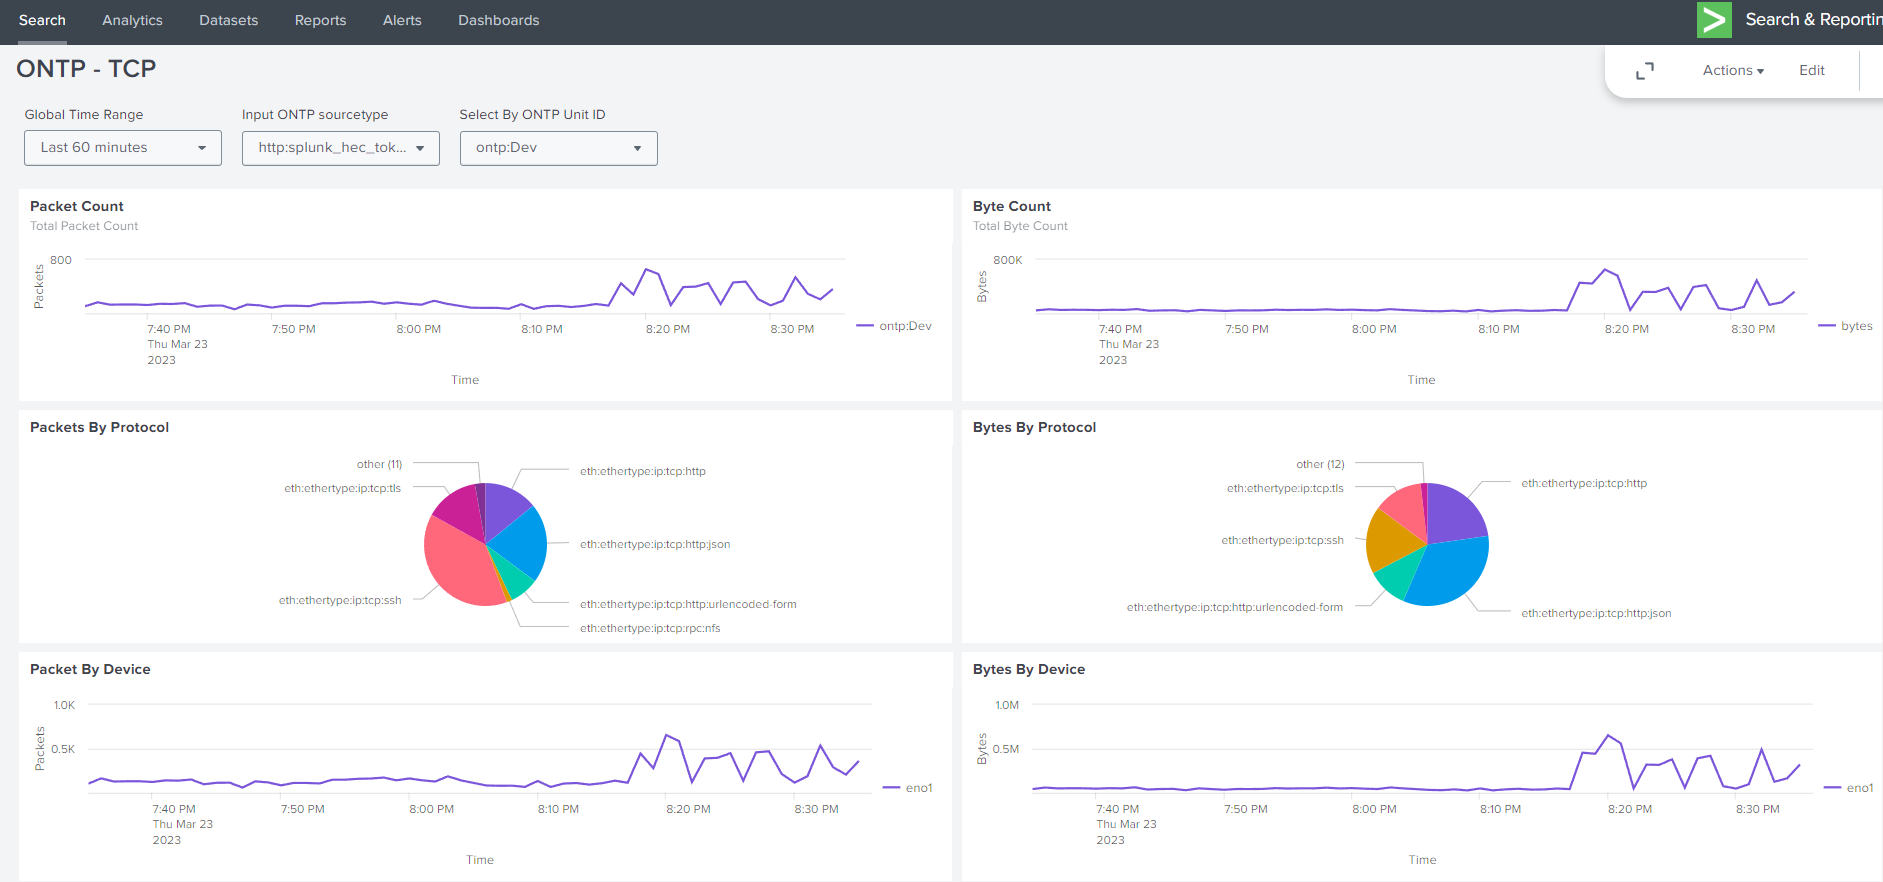
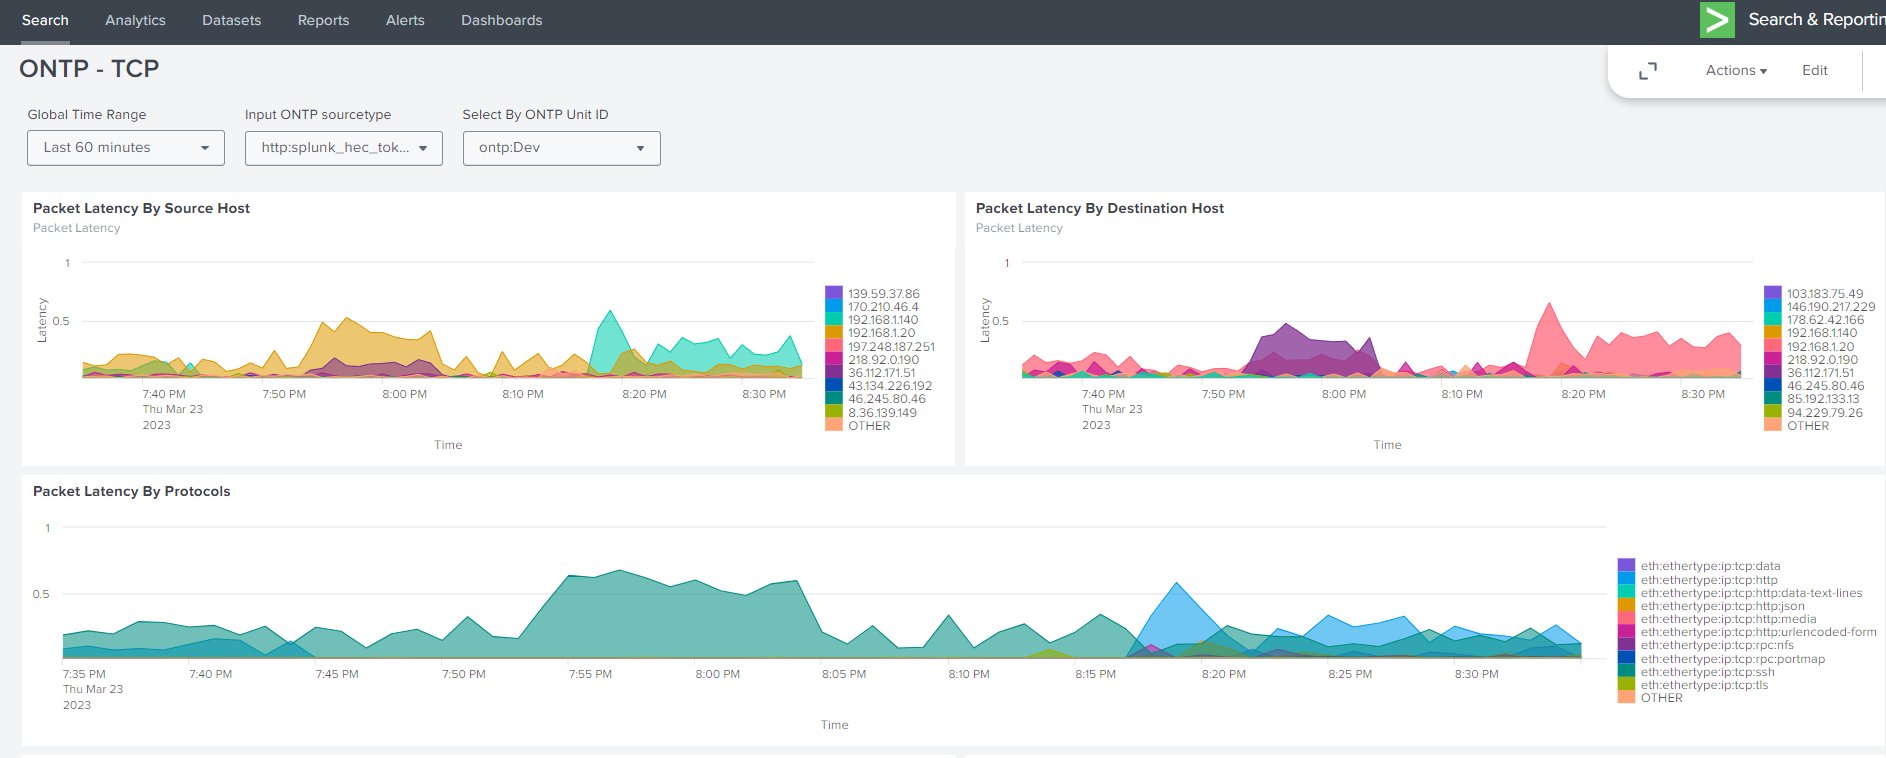
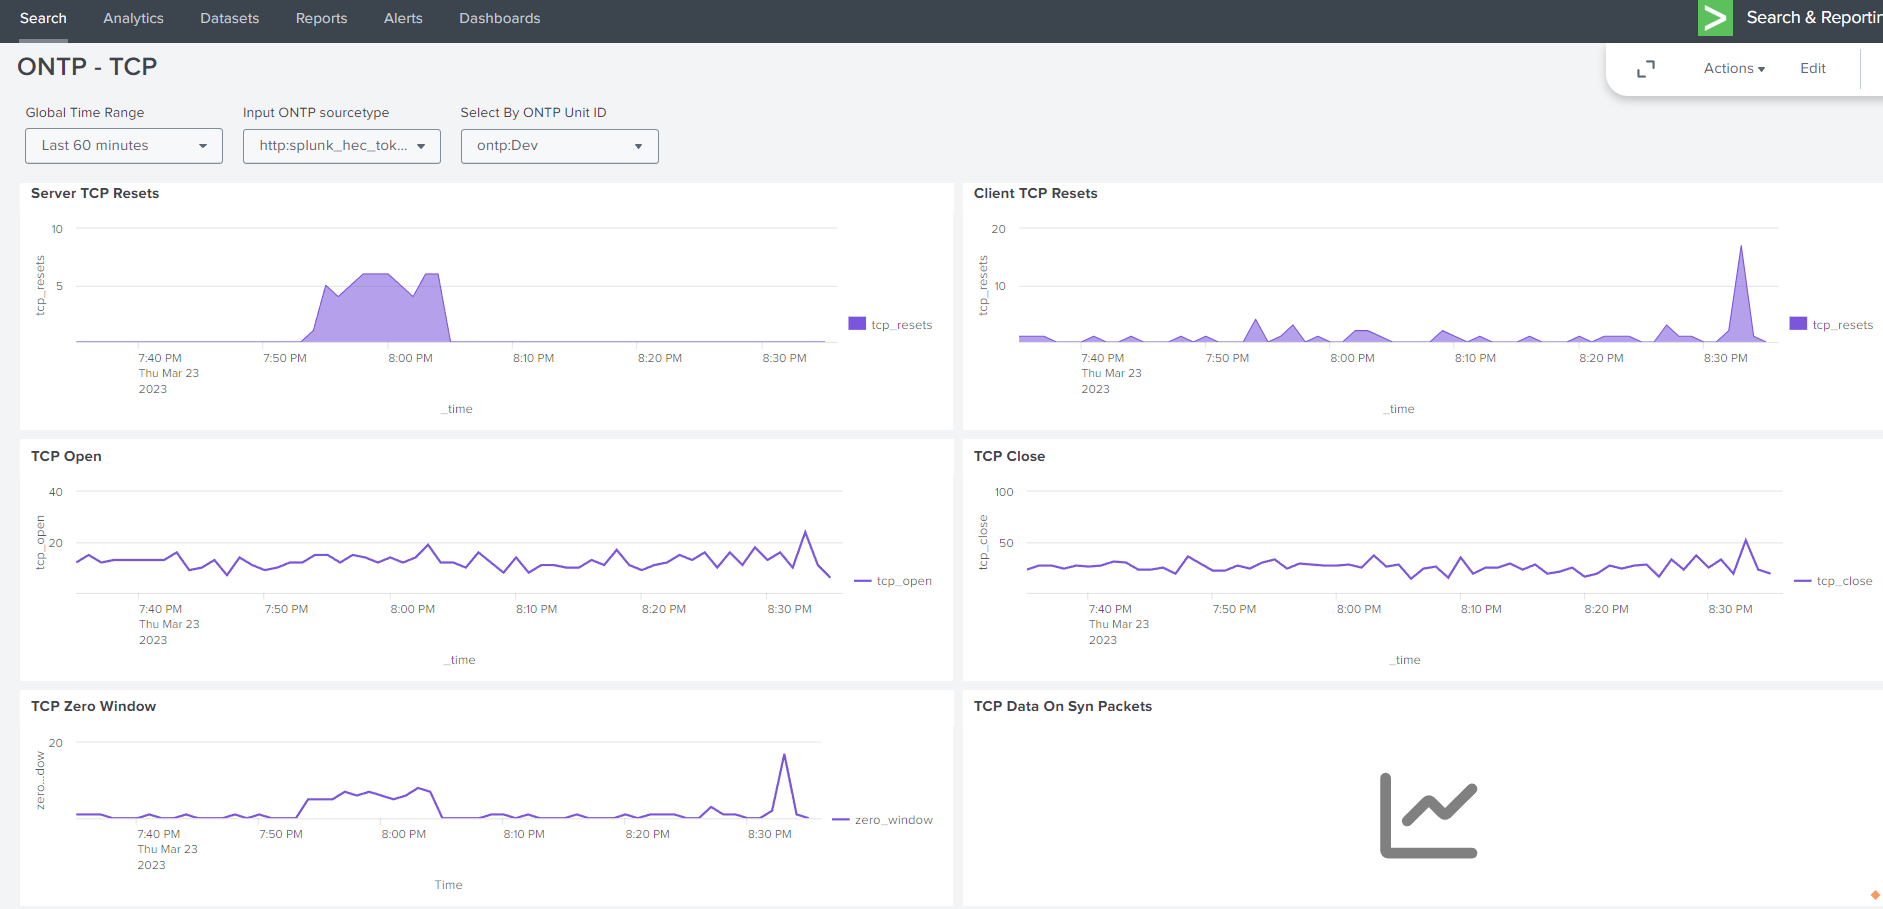
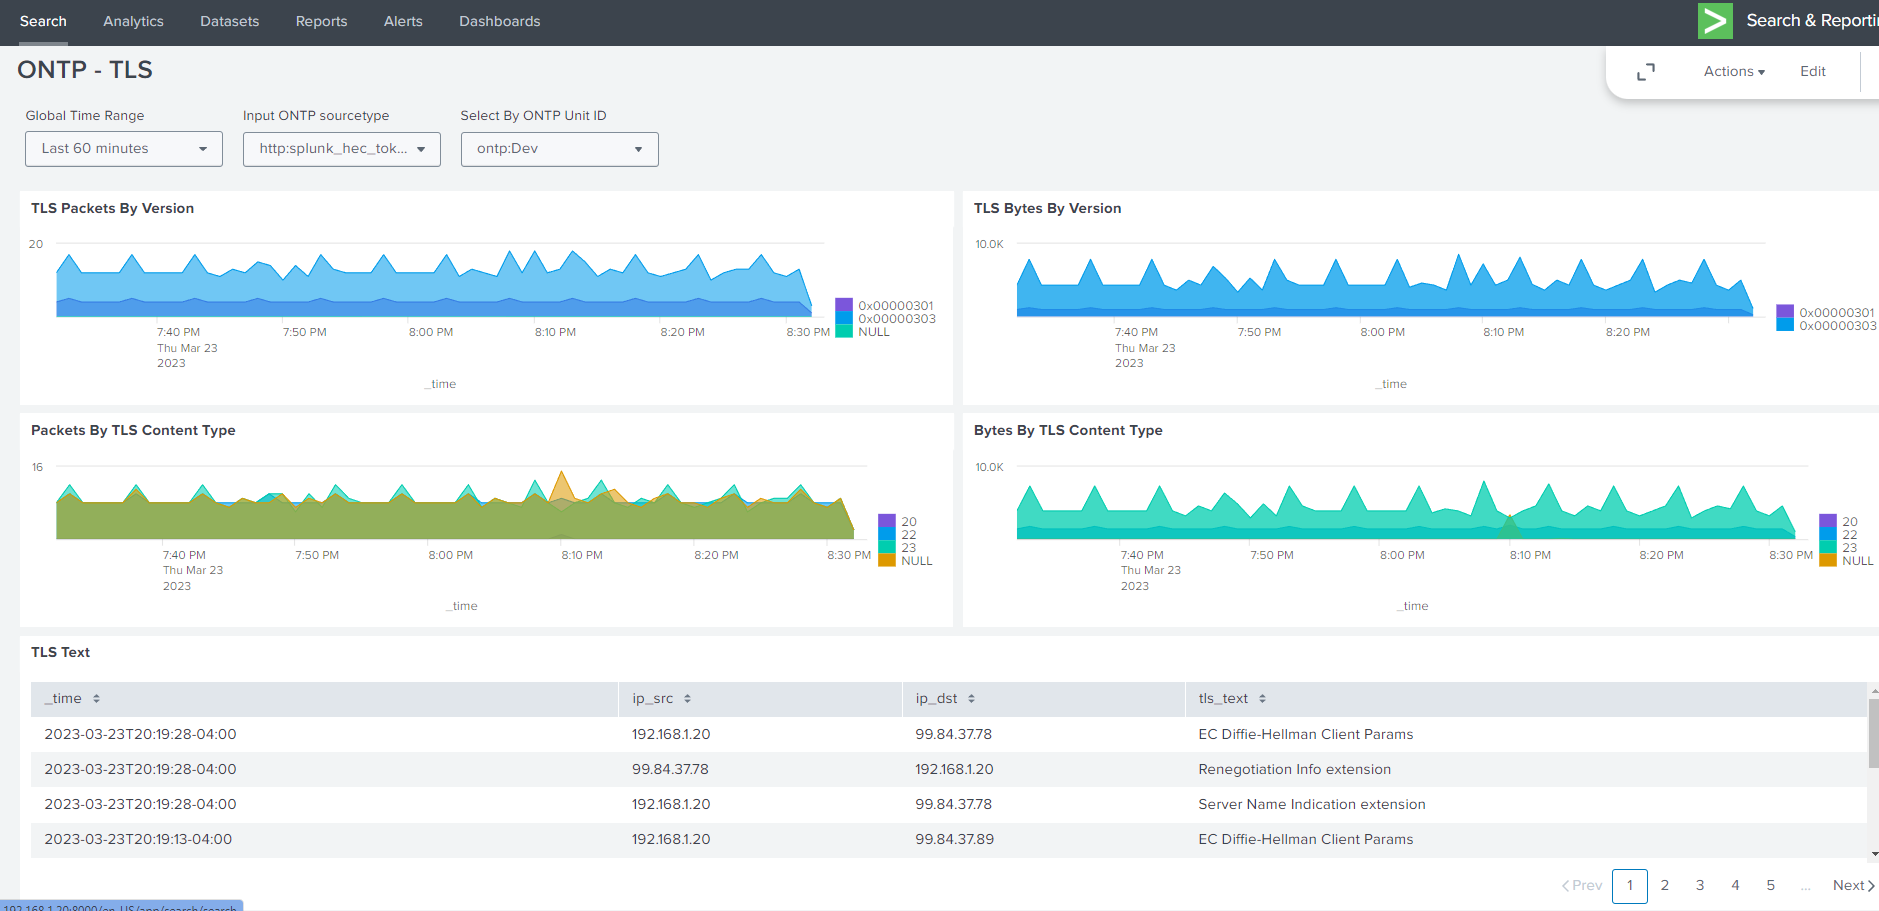
4.1.2. Dashboards Examples Views#
4.1.2.1. Example Splunk Dashboards#
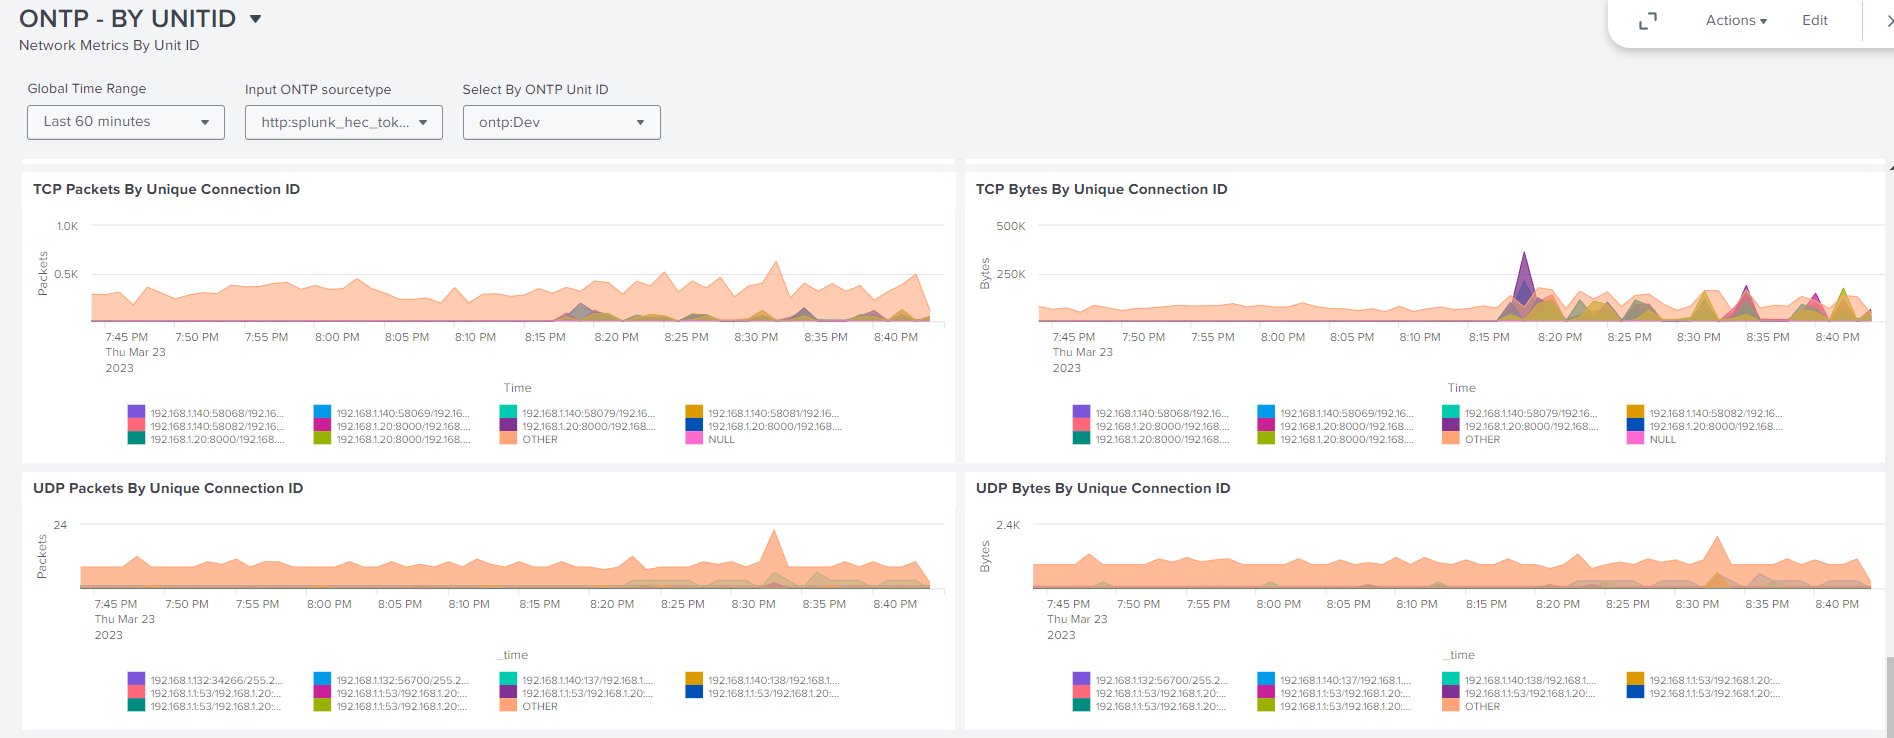
4.1.2.2. Example Grafana Dashboards#